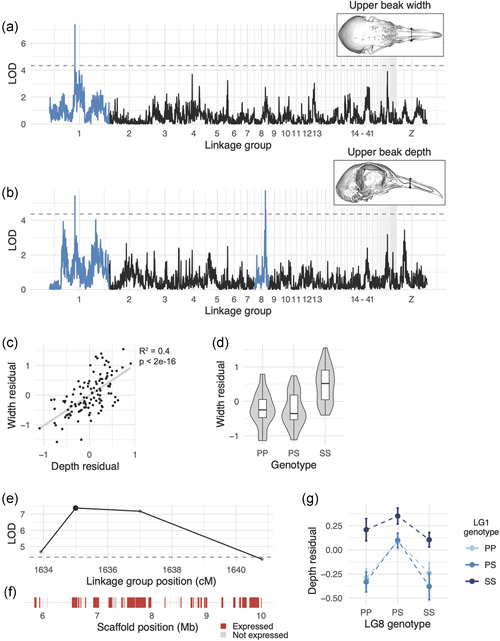
Figure 2.

Quantitative trait locus (QTL) associated with upper beak width and depth. (a, b) Genome‐wide QTL scans for upper beak width (a) and depth (b). Dashed horizontal line indicates 5% genome‐wide significance threshold and linkage groups with significant QTL peaks are highlighted in blue. (c) Scatterplot of upper beak width and depth measurements for all Pom × Scan F2 individuals. Plotted values are residuals from regression on body mass. (d) Beak width effect plot. Letters denote significance groups, p values determined via Tukey's test: PP versus SS = 4.3e−06, PS versus SS = 9.1e−06. (E) LOD support interval for beak width QTL scan. Dots indicate linkage map markers; the larger black dot highlights the peak marker that was used to estimate QTL effects in (d). (f) Genes located within LOD support interval, color‐coded based on expression status in HH29 facial primordia. Expressed = transcript per kilobase million (TPM) 0.5; not expressed = TPM < 0.5. (g) Interaction plot between LG1 and LG8 QTL associated with upper beak depth. P, allele from Pom founder; S, allele from Scan founder [Color figure can be viewed at wileyonlinelibrary.com]
