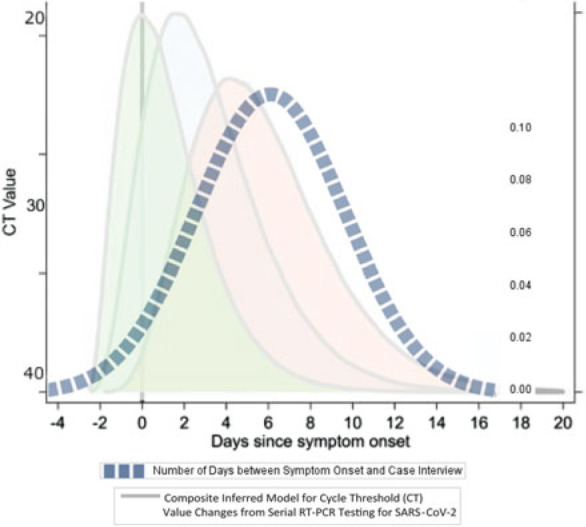
FIGURE 2.

Timing of Case Interview Relative to Inferred Duration of Infectiousness Period of SARS-CoV-2a
aThe area under the dotted line represents the distribution of when case interview was conducted relative to onset of symptoms. The underlying pastel curves are reproduced from Byrne et al23 and represent SARS-CoV-2 viral shedding relative to symptom onset. Three curves are depicted as there remains uncertainty as to whether peak viral shedding occurs prior to, at, or after symptom onset, and how the temporality of infectiousness varies by SARS-CoV-2 variant. This figure is available in color online (www.JPHMP.com).
