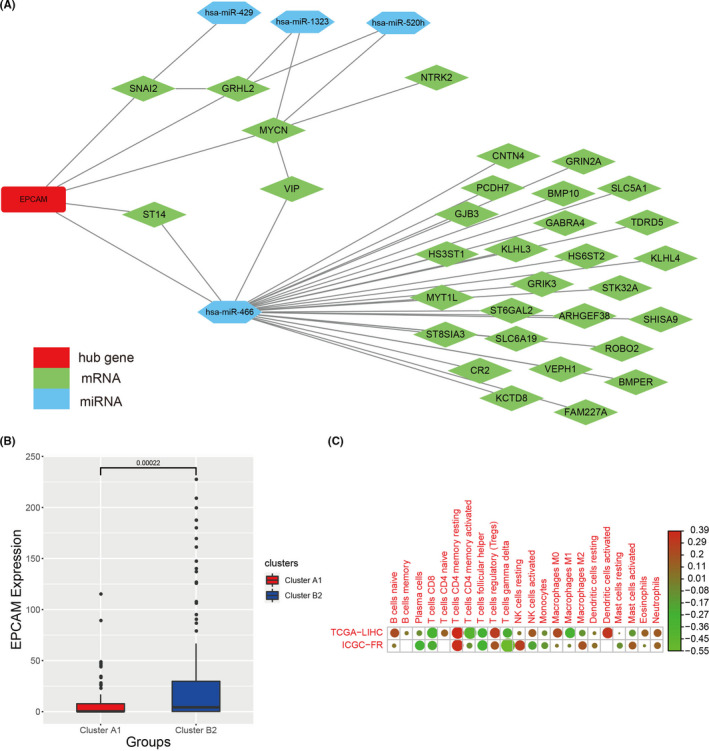
FIGURE 6.

The analysis of the EPCAM gene. (A) The EPCAM related mRNAs and miRNAs. The red represented the hub gene, the green represented mRNAs, and the blue represented miRNAs. (B) The difference of EPCAM expression level between cluster A1 and cluster B2. (C) Correlation analysis between immune infiltrating cells and EPCAM expression level
