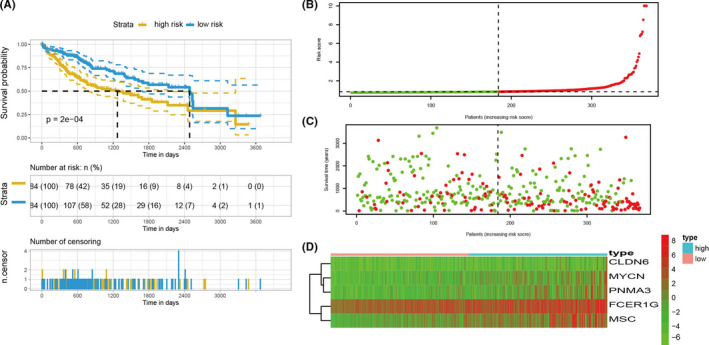
FIGURE 7.

The construction of a prognostic model. (A) KM survival curve of patients with HCC in the training cohort. (B) Risk scores distribution of patients in the training cohort. The red points represented patients in the high‐risk group. The green points represented patients in the low‐risk group. (C) Survival time and survival status of patients in the training cohort. The red points represented patients with dead status. The green points represented patients with alive status. (D) The expression levels of prognostic genes in the training cohort. The red color represented that this gene was upregulated in patients and the green color represented that this gene was downregulated in patients. The depth of the color represented the level of expression. The “high” represented patients in the high‐risk group and the “low” represented patients in the low‐risk group. KM, Kaplan–Meier; HCC, hepatocellular carcinoma
