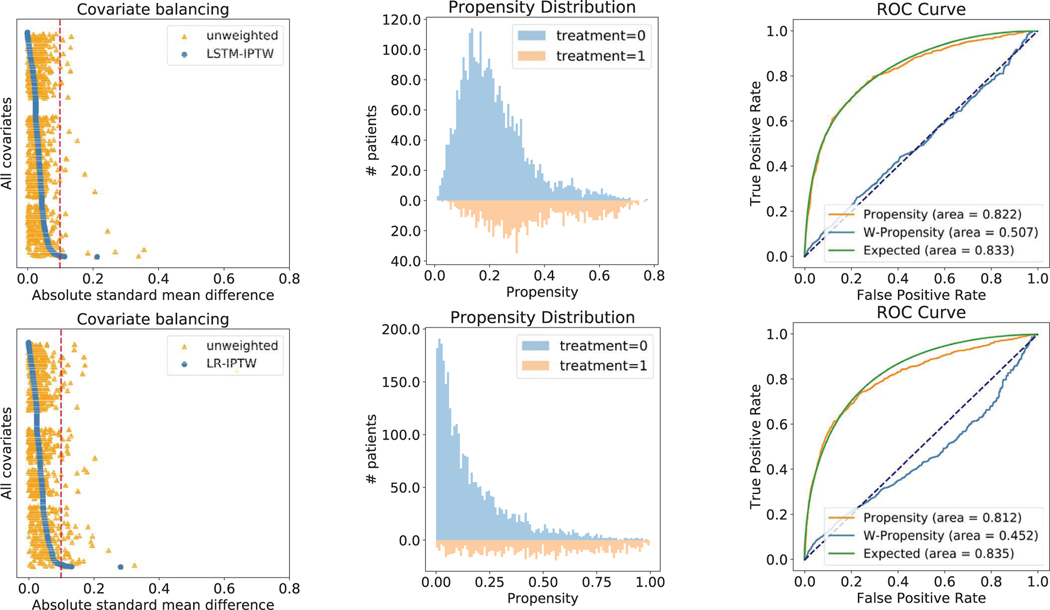
Extended Data Fig. 2 |. Performance comparison of LSTM-IPTW and LR-IPTW using drug candidate: diltiazem (with known CAD indication).
The three figures on the top are results obtained from LSTM-IPTW, while the figures on the bottom are from LR-IPTW. a, and (d) The absolute SMD of each covariate in the original data (orange triangles) and in the weighted data (blue circles). b, and (e) The distribution of estimated propensity scores over user (orange area) and non-user (blue area) cohorts. c, and (f) The ROC curves for the propensity model (orange), expected value (green) and weighted propensity (blue).

