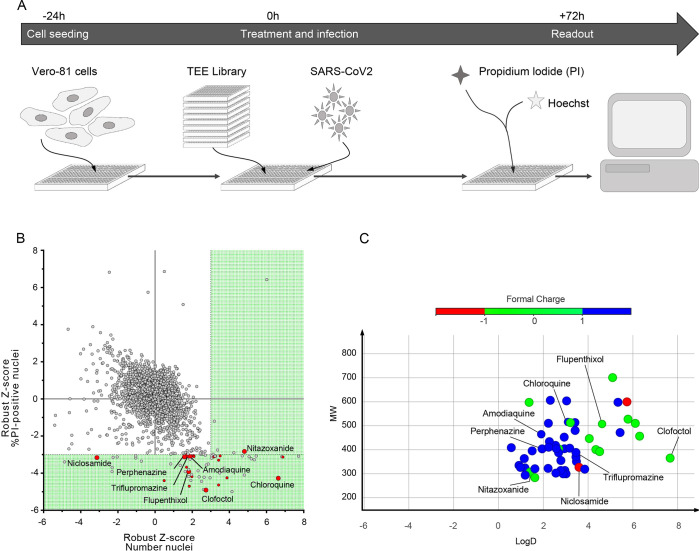
Fig 1. HCS screen of Apteeus TEElibrary for the identification of anti-SARS-CoV-2 compounds.
A, Workflow overview of the screening process. B, Dot-plot representations of all compounds tested based on their robust-Z-score for both the numbers of nuclei and the percentages of PI-positive nuclei. Dotted lines are indicative of the thresholds chosen for hit selectivity (within the green area). C, Dot-plot representation according to the molecular weight and the LogD of the compounds of interest. Dots are color-coded based on the ionization state at physiological pH.

