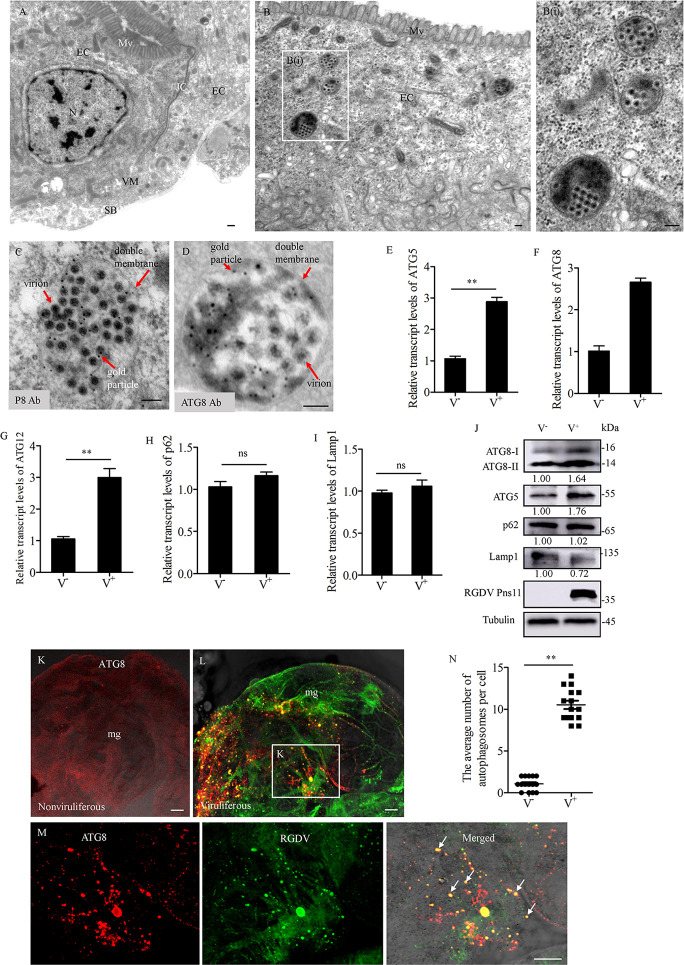
Fig 1. RGDV infection induces autophagosome formation in the intestines of R. dorsalis.
(A-D) Transmission electron micrographs showing virus-induced autophagosomes in the midgut epithelial cells. (A) The midgut epithelium, showing microvilli, intercellular tight junctions, visceral muscles, and serosal barrier. (B) Virus-containing autophagosomes within virus-infected midgut epithelium. Panel B (I) is an enlargement of the boxed area in panel B. EC, epithelial cell; JC, junctional complexes; N, nucleus; Mv, microvilli; VM, visceral muscles; SB, serosal barrier. (C, D) Immunogold labeling of RGDV P8 (C) or ATG8 (D) in virus-containing autophagosomes. Virus-infected intestines of R. dorsalis were immunolabeled with P8- (C) or ATG8- (D) specific IgG as the primary antibody, followed by treatment with 10-nm gold particle-conjugated IgG as the secondary antibody. (E-I) Relative transcript levels for ATG5 (E), ATG8 (F), ATG12 (G), p62 (H) and Lamp1 (I) genes in nonvirulifeorus or viruliferous insects, as detected by RT-qPCR assay. Bars represent means ±SD from three independent experiments. Significance (**) was determined at P < 0.01. ns, not significant. (J) Relative protein expression levels of ATG8, ATG5, p62, Lamp1 and Pns11 in nonviruliferous or viruliferous insects as detected by western blot assay. Insect Tubulin was detected as a control. Relative protein levels were determined using ImageJ and the accumulation levels of ATG8-II, ATG5, p62, and Lamp1 in nonviruliferous insects were normalized to 1. (K-M) Immunofluorescence assay showing the distribution of ATG8-puncta in the midgut epithelial cells from nonviruliferous (K) or viruliferous (L) insects. The intestines were immunostained with P8-FITC (green) and ATG8-rhodamine (red). Panel M was an enlargement of the boxed area in panel L to show the colocalization of P8 and ATG8 (arrows). (N) The average number of ATG8-puncta per cell in virus-free or infected midgut epithelial cells. Bars represent means ±SD from more than 10 individual cells. Significance (**) was determined at P < 0.01. V−, nonviruliferous. V+, viruliferous. Bars in A-D, 100 nm, Bars in K-M, 5 μm.

