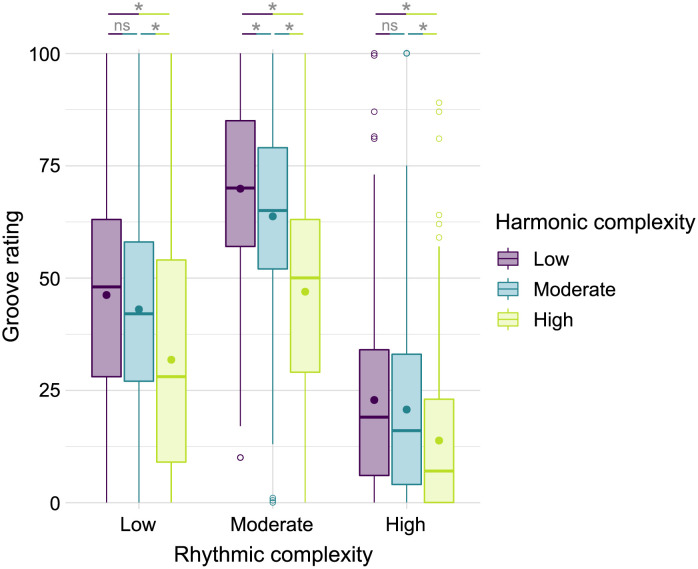
Fig 2. Groove ratings as a function of rhythmic and harmonic complexity.
Dots represent mean groove ratings. Boxplots: The centerline represents the median. The lower and upper ends of the boxes correspond to the first and third quartiles. Whiskers represent lowest and highest values within 1.5 × interquartile range (IQR) from the lower and upper quartiles, respectively. Circles represent values outside 1.5 × IQR. ns = nonsignificant, * p < .001.

