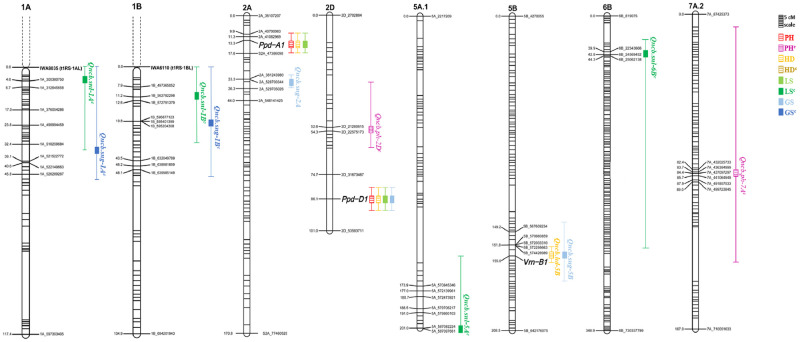
Fig 2. Genetic map location of QTL detected in this study.
QTL locations and interval sizes are indicated by bars and brackets, respectively, on the right-hand side of each chromosome, and are based on the genetic marker information in Tables 2 and 3. c = covariate in standard interval mapping analysis; numbers after the underscore correspond to physical positions based on Chinese Spring RefSeq v2.0.

