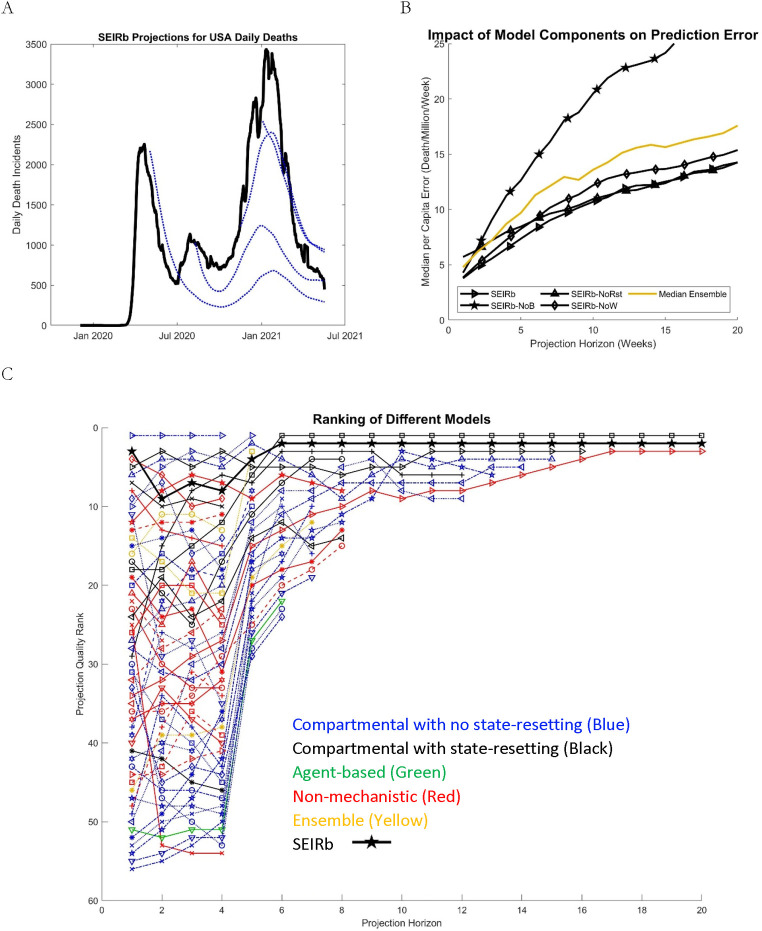
Fig 3. Comparison of forecasting quality among different models.
A) Data (solid-black) and predictions (dotted lines) for SEIRb national forecasts made based on data by 5/2/20, 8/8/20, 11/14/20, and 1/2/21. B) Forecasting error per capita for SEIRb and its variants (without seasonality: -NoW; without behavioral feedback: -NoB; without resetting: -NoRst) compared with the median ensemble forecast from the CDC model set and the SEIRb group. C) Forecast quality ranks for the CDC model set and the SEIRb group, based on regressing Ln (per-capita projection error) against models, controlling for location-horizon-week combinations. Individual model names corresponding to each line are available in Fig C in S5 Text. Color codes: compartmental models without state-resetting (blue); with state-resetting (black); non-mechanistic (red); agent-based (green); and ensemble (yellow).

