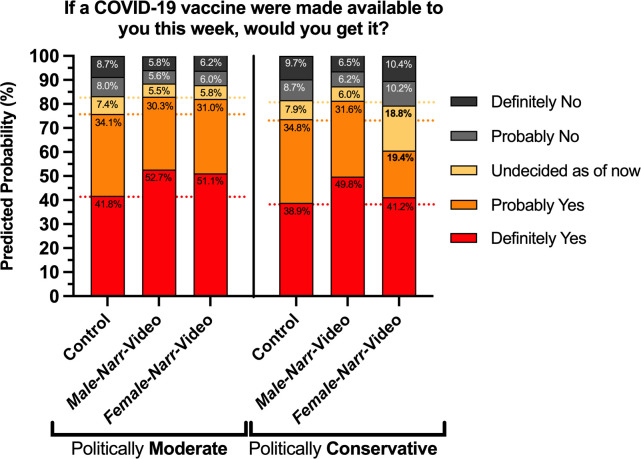
Fig 2. Model 2 predicted probabilities.
Predicted probabilities from Model 2 upon exposure to each of the four interventions for a participant who is white, male, under 55, with at least a B.A. degree, and comparing whether they identify as politically moderate or conservative. The horizontal dotted lines are the category cutoffs for the control group for ease of visual comparison.

