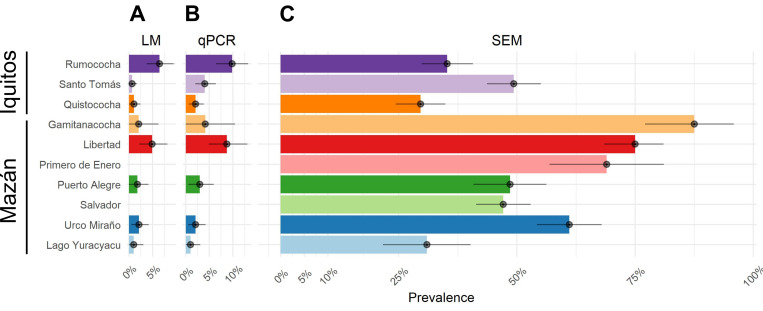
Fig 2. Prevalence of Plasmodium vivax measured by three tools in communities of Iquitos and Mazán.
A) Prevalence of P. vivax by light microscopy (LM). B) Prevalence of P. vivax by qPCR and C) Prevalence of P. vivax by antibody responses to SEM. Dots denote the mean and lines denote the 95% confidence intervals.

