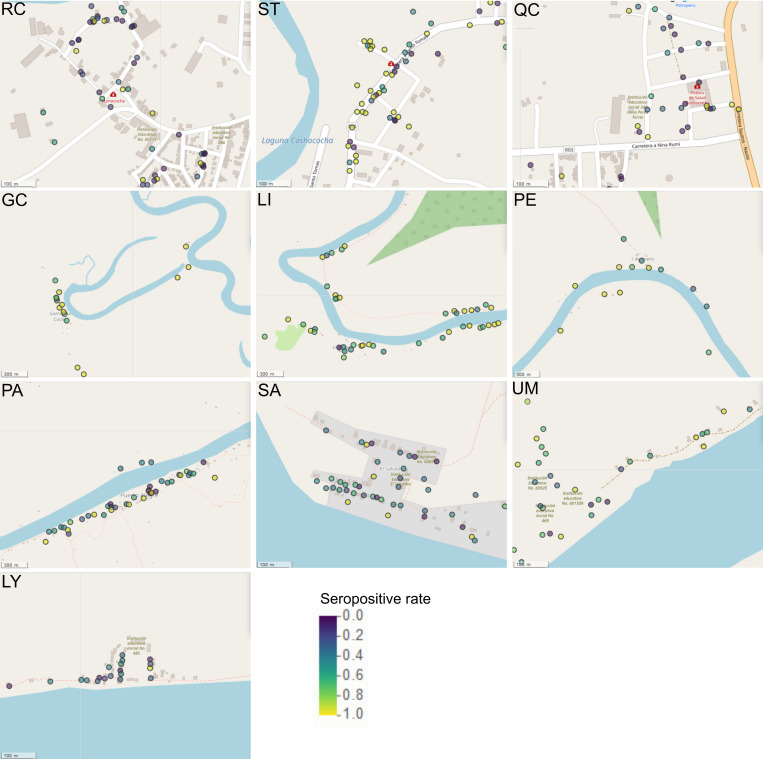
Fig 4. Spatial distribution of seropositive cases in the study sites.
The seropositive rate per household was calculated as the proportion of seropositive individuals per number of household members participating in the study. The figure depicts households in the villages of Iquitos: Rumococha (RC), Santo Tomás (ST) and Quistococha (QC), and the villages of Mazán: Gaminatacocha (GC), Libertad (LI), Primero de Enero (PE), Puerto Alegre (PA), Salvador (SA), Urco Miraño (UM), and Lago Yuracyacu (LY). Each point indicates a household location. Households are colored accordingly to their seropositive rate. Map generated with QGIS 2.16 (QGIS Development Team, 2016. QGIS Geographic Information System. Open Source Geospatial Foundation Project) based on public geographic data extracted from OpenStreetMap contributors (www.openstreetmap.org) under Open Data Commons Open Database License (ODbL) 1.0 (http://openstreetmap.org/copyright).

