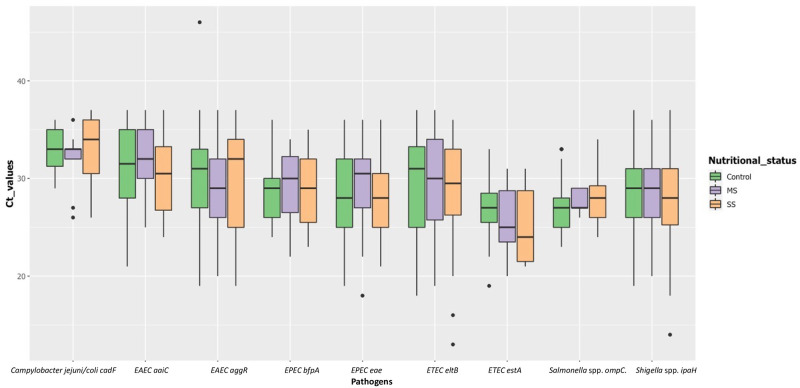
Fig 3. Box plot showing CT values for pathogens targeted by real-time PCR among stunted (104 moderately stunted and 96 severely stunted) and controls (N = 264).
Boxes show the median (midline) and the 25th and 75th percentiles, and bars indicate the 10th and 90th percentiles. Only the positive subjects (CT values = <37) for the respective pathogen agent was considered.

