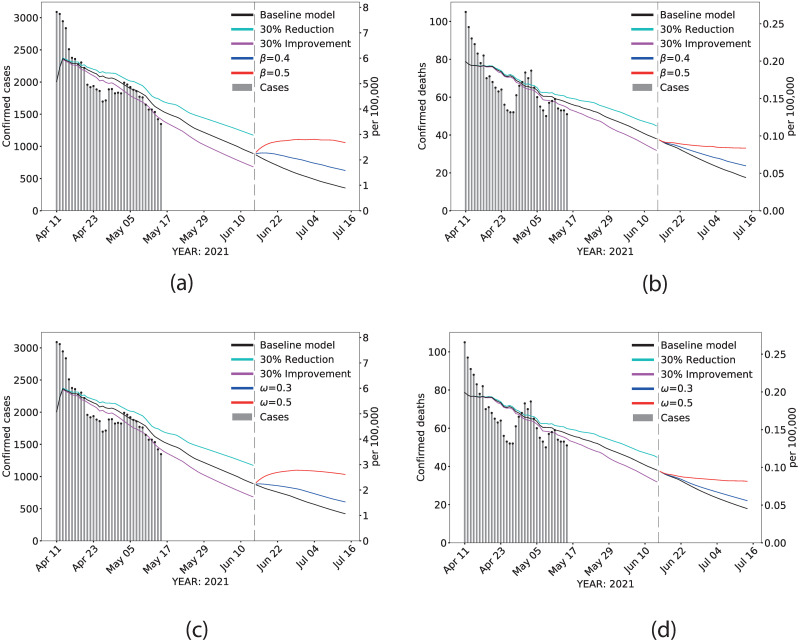
Fig 2. Scenarios.
Estimated statewide confirmed cases and confirmed deaths during live data collection, extrapolated between May 18th and June 15th for different vaccination rates, and predicted beyond June 15th with different effective population proportions and transmission rates. (A) and (B): effects of varying transmission rate on confirmed cases and confirmed deaths, respectively. (C) and (D): effects of varying the effective population proportion on confirmed cases and confirmed deaths, respectively. Dashed vertical line: June 15th. Gray vertical bars: daily reported data. Black line: baseline scenario, before and after opening. Cyan line: projection from May 18th assuming a 30% reduction in the current vaccination rate. Magenta line: projection from May 18th assuming a 30% increase in the current vaccination rate. The values used for β = 0.4, 0.5, and ω = 0.3, 0.5 were selected according to historical data in CA (see S6 Fig in S1 File).

