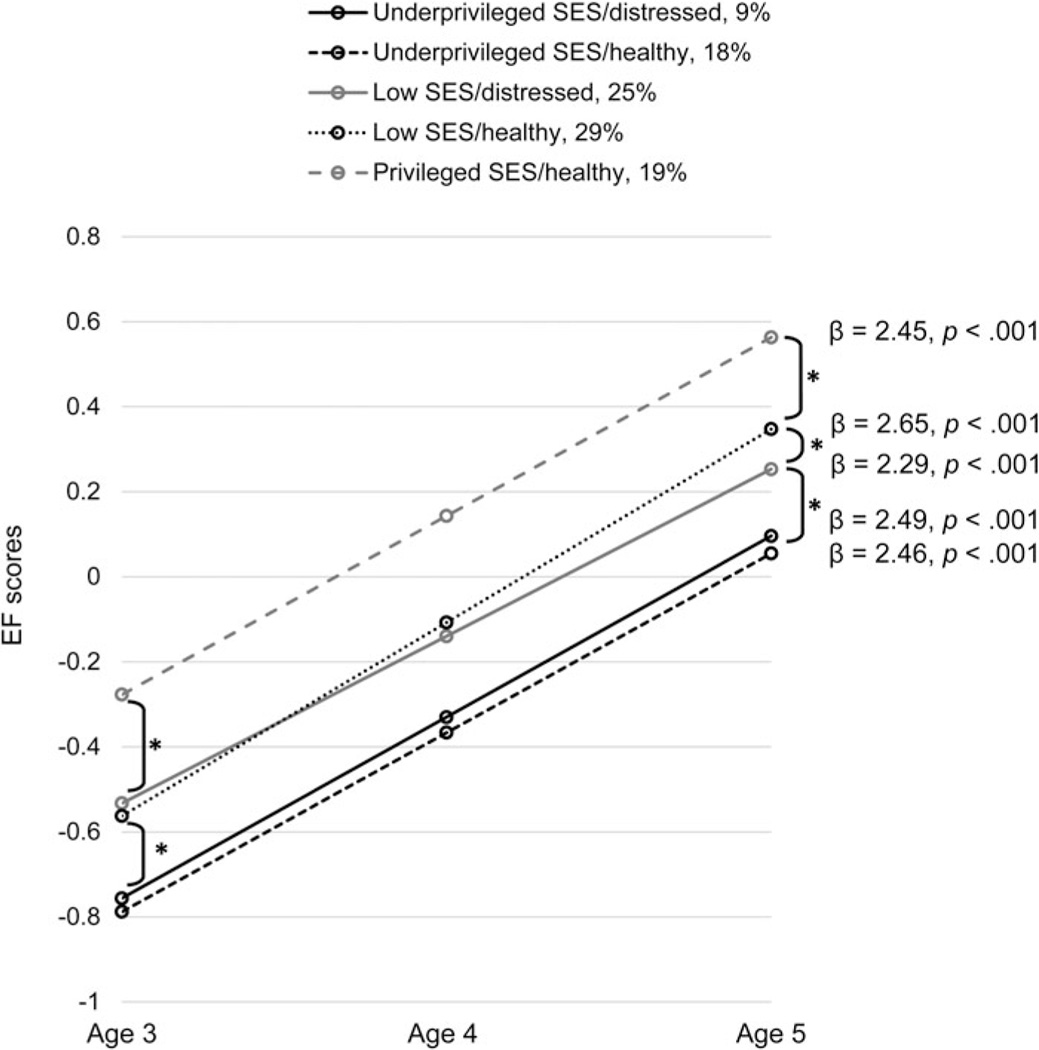
Figure 2.
Developmental trajectories of executive function (EF) across profiles. Standardized coefficients for the growth rates of EF in each profile are presented. The growth rates of EF significantly differed in the Low socioeconomic status (SES)/healthy and Low SES/distressed profiles at p < .05. An asterisk represents a significant difference in the EF scores at age 3 or at age 5 between profiles at p < .05.

