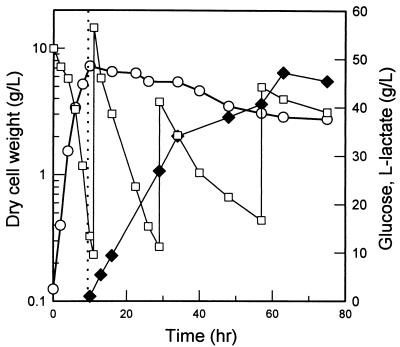
FIG. 7.
Production of l-lactate with the E. coli RR1 pta ldhA double mutant harboring plasmid pLS65 (l-LDH). The dotted line indicates the time when the culture was shifted from aerobic conditions to anaerobic conditions. The experiment was performed in triplicate, and the standard deviations were less than 10%. Symbols: ○, cell dry weight; □, glucose concentration (intermittent feeding); ⧫, l-lactate concentration.

