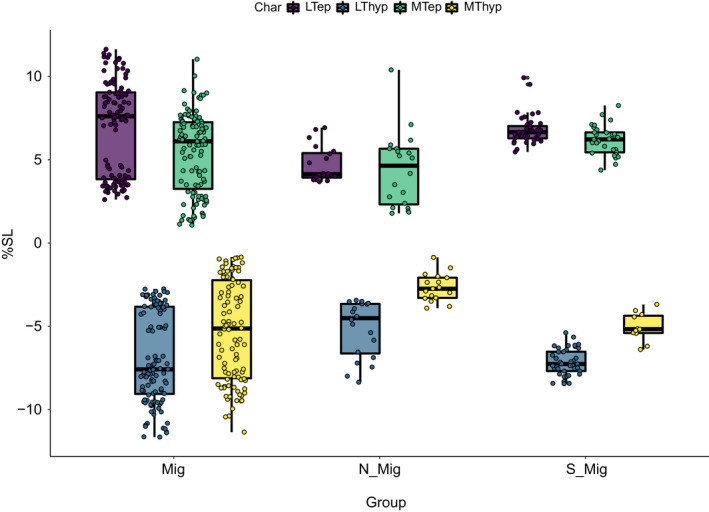
FIGURE 21.

Boxplots of dispersion of traits for each of the three main groups. Values indicated as percentage of standard length. Mig = Astronesthes sp., Eustomias obscurus, Eustomias simplex, Sigmops elongatus; Polymetme sp., Argyropelecus affinis; S‐Mig = Chauliodus sloani; Non‐Mig = Malacosteus australis
