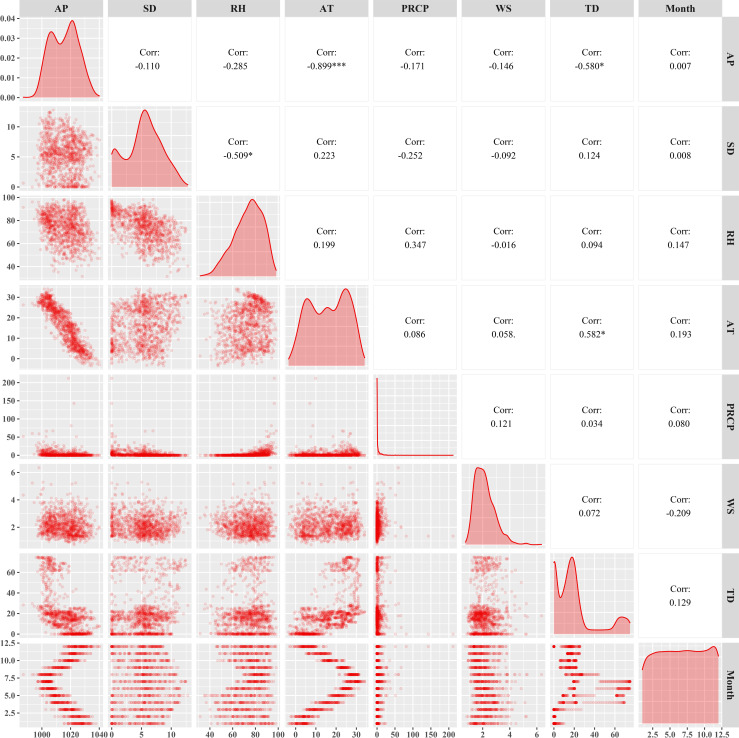
Fig 4. Correlation analysis between no time lagging meteorological factors and tick density.
AP = Air pressure; SD = Sunshine duration; RH = Relative humidity; AT = Average temperature; PRCP = 24-hour precipitation; WS = Wind speed; TD = Tick density. Correlation coefficient (r) greater than 0.7 indicates a strong correlation between the two.

