. 2022 May 19;11:e73625. doi: 10.7554/eLife.73625

Figure 4. BLOS1 confers host cell susceptibility to Brucella infection and controls Brucella intracellular trafficking.

(A) Western blot analysis of α-tubulin acetylation (left) and quantification of α-tubulin acetylation level (right) in control containing Cas9 and a nonspecific gRNA and the nonfunctional Bloc1s1 mutant (mBloc1s1) in RAW 264.7 Cas9 cells. Ac-Tub: anti-acetylated antibody. (B) Western blot analysis of α-tubulin acetylation (left) and quantification of α-tubulin acetylation levels (right) in control (wt-Bloc1s1, overexpressing WT Bloc1s1) cells and cells that express the RIDD-resistant Bloc1s1 variant (Rr-Bloc1s1) treated or untreated with 4μ8C (50 μM), Tm (5 μg/ml), or both for 4 hr. CFU assays for Bm16M infection of RAW264.7 cells in which Bloc1s1 is nonfunctional (C), RIDD resistant (D) at the indicated h.p.i. (E) BLOS1 degradation assay during Brucella infection (upper panel) and quantification of the relative BLOS1 expression level (compared to the level of the loading control GAPDH) (lower panel) at the indicated h.p.i. ns: no significance. Colocalization of BCV with calreticulin (CRC) or cathepsin D (CTD) (F) and quantification of BCV-CRC+ (G) or BCV-CTD+ (H) in control and mBloc1s1 cells treated with or without 4μ8C (50 μM) at the indicated h.p.i. Red asterisks: significance (p < 0.001) compared to control cells at 6 h.p.i. Colocalization of BCV with CRC or CTD (I) and quantification of BCV-CRC+ (J) or BCV-CTD+ (K) in the wt-Bloc1s1 and Rr-Bloc1s1 cells treated with or without 4μ8C (50 μM) at the indicated h.p.i. (L) Quantification of BLOS1 fluorescence integrated density (FID) per BCV in the mBloc1s1, Rr-Bloc1s1, or their corresponding control cells treated with or without 4μ8C (50 μM) at the indicated h.p.i. S: significance (p < 0.01) compared to that without 4μ8C treatment. Host cells were infected with or without Bm16M, and at the indicated h.p.i., the cells were harvested for immunoblotting assays or fixed and subjected to confocal immunofluorescence assays. Blots/images are representative of three independent experiments. Statistical data represent the mean ± standard error of mean (SEM) from three independent experiment. *p < 0.05; **p < 0.01; ***p < 0.001.

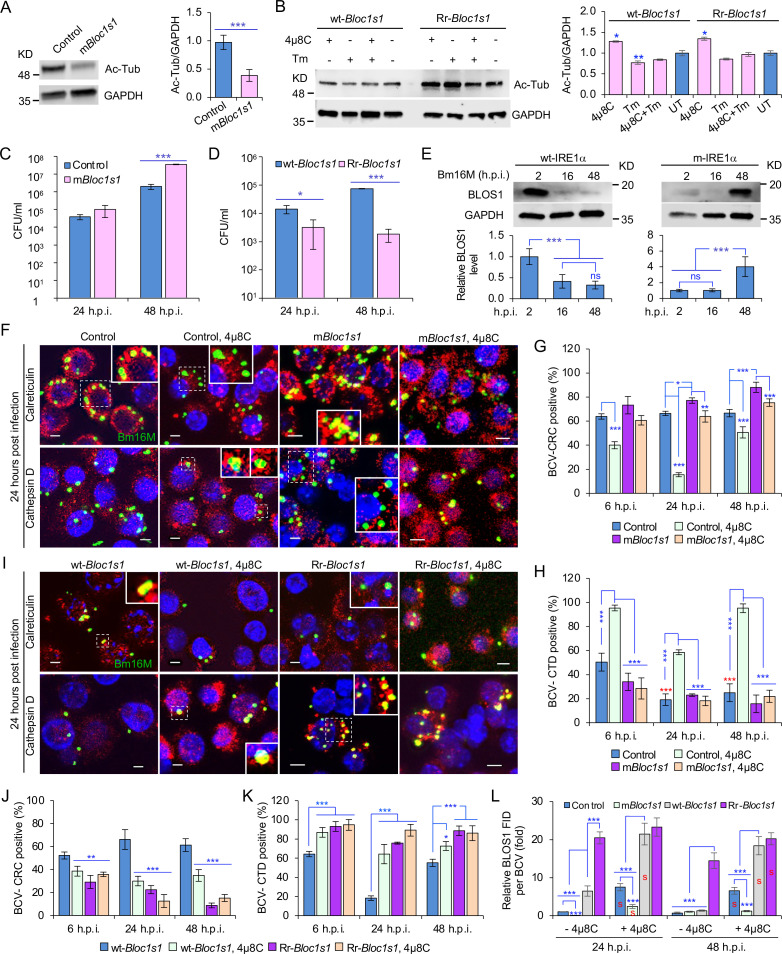
Figure 4.

Figure 4—figure supplement 1. Generation of nonfunctional and overexpression Bloc1s1 variants.

Figure 4—figure supplement 1.

Strategies for generation of nonfunctional Bloc1s1 (mBloc1s1) (A) or RIDD-resistant Bloc1s1 (Rr-Bloc1s1) (B) constructs that are used to generate mBloc1s1 or Rr-Bloc1s1 mutant cells. (C) CFU analysis of Bm16M infection of the murine osteoblastic MC3T3-E1 wild-type (WT), MC3T3-E1-derived RFP-tagged WT (RFP-tagged WT), or RIDD-resistant Blos1(Blos1s) overexpression (Blos1s-FLAG) cell lines (Bae et al., 2019) (gift from the Hollien lab, and used as controls to compare the effect of the Rr-Bloc1s1 cells on Brucella intracellular replication). The indicated cell lines were pretreated with either 1× phosphate buffered saline (PBS) or 4μ8C (50 μM) 1 hr before infection. The pretreated cells were then infected with Bm16M and subjected to gentamicin protection analysis. At 48 h.p.i, the intracellular CFUs were determined. Bloc1s1 mRNA expression assays for the mBloc1s1 (D) or Rr-Bloc1s1 (E) and control cells infected with or without BaS2308 and treated with or without 4μ8C at the indicated h.p.i. via qRT-PCR. Blue asterisks: compared to the uninfected control without 4μ8C. Uninf.: uninfected cells. Data represent the means ± standard error of mean (SEM) from three independent experiments. *, **, and ***: significance at p < 0.05, 0.01, and 0.001, respectively.
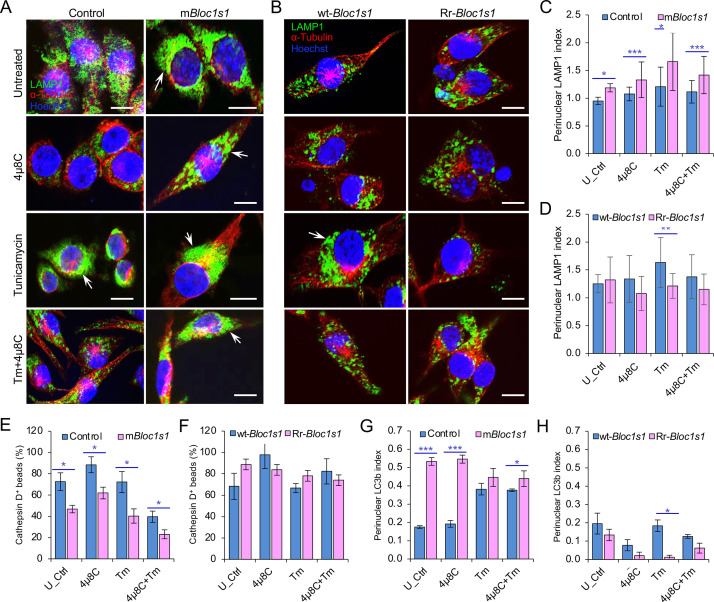
Figure 4—figure supplement 2. Cells with BLOS1 deficiency or RIDD resistance differently control lysosome intracellular trafficking.

Figure 4—figure supplement 2.

Host cells were treated with or without the indicated drugs and at 4 hr post treatment, drug-treated or untreated host cells were fixed and subjected to confocal immunofluorescence assays. Late endosome/lysosome (LE/Lys) trafficking in mBloc1s1 (A) or Rr-Bloc1s1 (B) and control cells in the presence of ER stress inducer tunicamycin (Tm) or IRE1α RNase inhibitor 4μ8C. The indicated cell lines were incubated with Tm, 4μ8C, or Tm + 4μ8C for 4 hr, the cells were then fixed and subjected to confocal immunofluorescence microcopy assay analysis. Bar: 10 μm. Quantification of LE/Lys retrograde trafficking in the mBloc1s1 (C) or Rr-Bloc1s1 (D) cells treated with Tm, 4μ8C, or Tm + 4μ8C at 4 hr. U_Ctrl: untreated control. Quantification of colocalization of latex beads with Cathepsin D in mBloc1s1 (E) or Rr-Bloc1s1 (F) cells treated with Tm, 4μ8C, or Tm +4μ8C for 4 hr. Quantification of autophagic flux (using LC3b as a marker) in mBloc1s1 (G) or Rr-Bloc1s1 (H) cells treated with Tm, 4μ8C, or Tm + 4μ8C for 4 hr. Images are representative of three independent experiments. Statistical data represent the mean ± standard error of mean (SEM) from three independent experiments. *p < 0.05; **p < 0.01; ***p < 0.001.
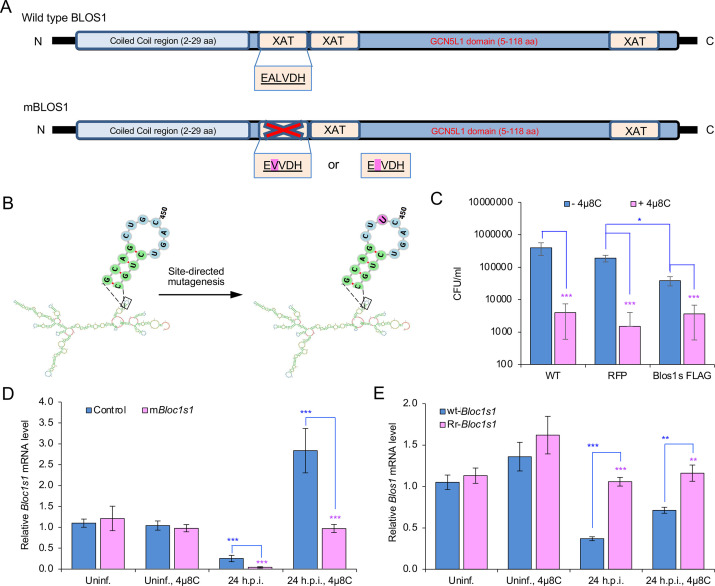
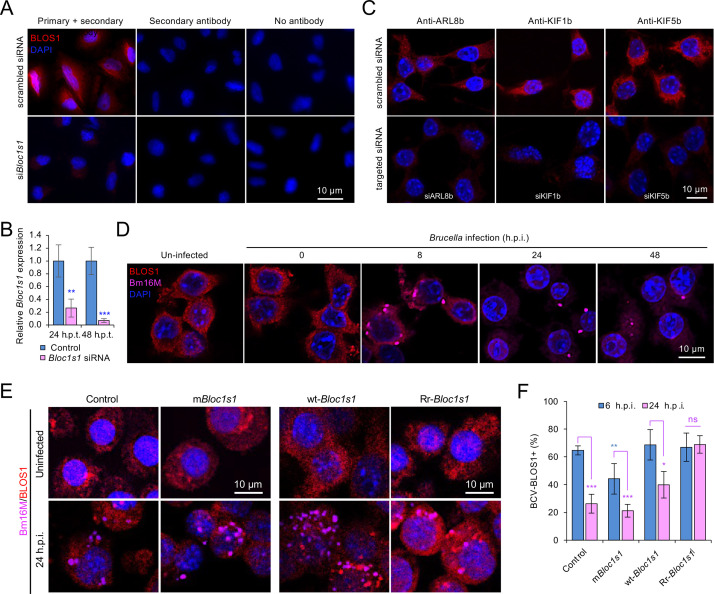
Figure 4—figure supplement 3. Host endogenous BLOS1 and the associated proteins are specifically recognized by the indicated homemade or commercial antibodies and differential interactions of Brucella and host BLOS1 during infection.

Figure 4—figure supplement 3.

(A) siRNA-mediated depletion of host (A549 cells) endogenous BLOS1 reduces immunofluorescence intensity detected by the homemade chicken antihuman/mouse BLOS1 antibody. (B) qRT-PCR analysis of expression levels of Bloc1s1 in the indicated siRNA transfected A549 cells at 24 or 48 h.p.t. Expression levels of Bloc1s1 gene was normalized to Gapdh expression. (C) siRNA-mediated depletion of host (RAW264.7 macrophages) endogenous ARL8b, KIF1b, or KIF5b reduces immunofluorescence intensity detected by the corresponding antibodies. (D) Brucella infection indues host BLOS1 degradation. The wild-type RAW264.7 macrophages were infected with B. abortus BaS19 at an MOI of 50, at the indicated hours post infection (h.p.i.), the control and infected cells were fixed and performed immunofluorescence microscopy assay using antibodies as mentioned above. (E) Colocalization of BCVs and host BLOS1 in Bm16M uninfected or infected RAW264.7 cells at 24 h.p.i. (F) Quantification of BCV-BLOS1+ in Bm16M-infected mBloc1s1 or Rr-Bloc1s1and control cells at 6 and 24 h.p.i. Blue asterisks: compared to the control. Images are representative of three independent experiments. Statistical data represent the mean ± standard error of mean (SEM) from three independent experiments. *p < 0.05; **p < 0.01; ***p < 0.001.