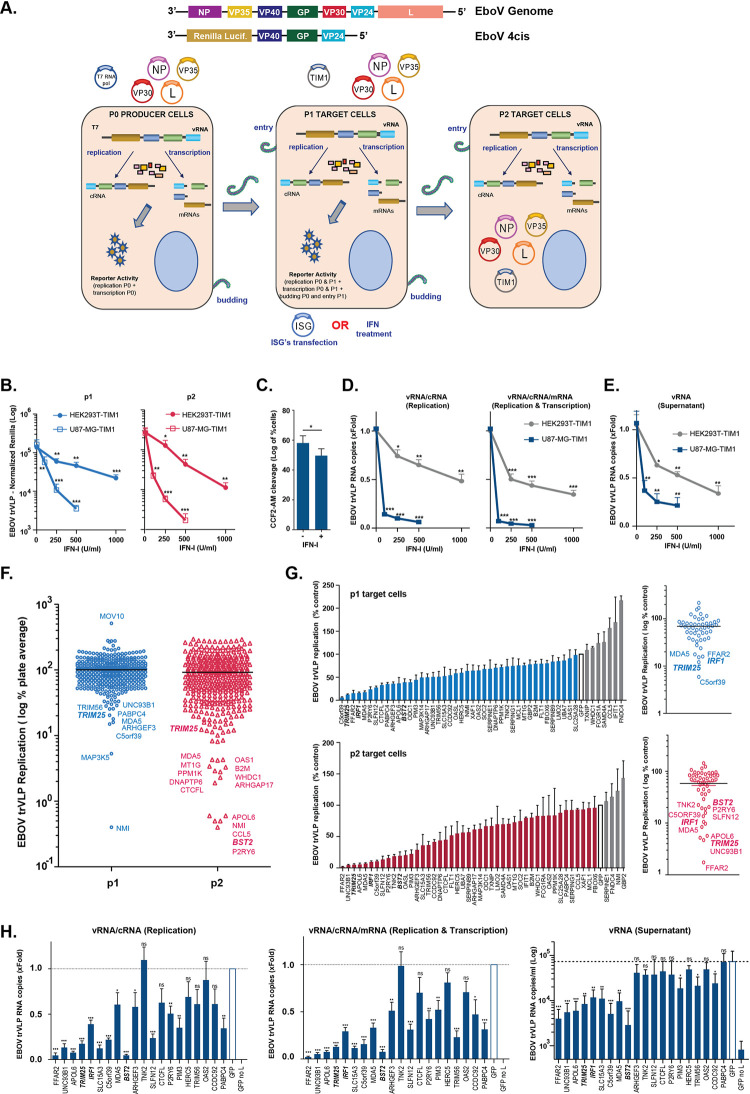
Fig 1. Human ISG-expression screening identifies novel candidates with antiviral activity against EBOV trVLP.
(A) Upper panels: Graphical representations of the Ebola virus genome, and of the tetra-cistronic minigenome (4cis) encoding Renilla luciferase (Rluc) used in the transcription- and replication-competent (trVLP) assay. Lower panel: Schematic representation of the EBOV trVLP assay. Plasmids expressing ISGs of interest were co-transfected with viral RNP proteins into p1 target cells. Alternatively, p1 target cells were pre-treated with IFN-I prior infection with EBOV trVLPs (detailed description in Material and Methods). (B) EBOV trVLP normalized reporter activity in HEK293T- and U87-MG-stably expressing TIM1 transfected with EBOV RNP proteins and pre-treated with increasing amounts of IFN-I 24 hours prior infection (p1 target cells, blue). Supernatants from p1 cells were harvested 24 hours post-infection, and used to infect HEK293T-TIM1 cells and reporter activities measured 24 hours later (p2 target cells, red). (C) HEK293T-TIM1 cells were pre-treated with IFN-I (1000U/ml) prior to transduction with BlaVP40-EBOV-GP virus-like particles. 24 hours later, viral particle entry was measured as percentage of cells presenting cleavage of CCF2-AM dye by flow cytometry. (D) Relative quantification of intracellular viral RNA levels in HEK293T-TIM1 (grey) and U87-MG-TIM1 (blue) p1 target cells pre-treated with IFN-I, and infected with EBOV trVLPs as in (B). Random hexamer primers were used to generate cDNAs and RT-qPCR analysis was performed using qPCR primers/probe sets targeting the 5’-trailer region of the trVLP 4cis minigenome (vRNA and cRNA, left panel), VP40 RNA (vRNA, cRNA and mRNA, right panel) or gapdh as endogenous control. Data presented as fold change compared to control (no IFN) based on ΔΔCt values. (E) Relative quantification of viral transcripts present on supernatants from (D). cDNA synthesis performed as above and RT-qPCR performed with primers/probe set targeting EBOV VP40 RNA. Data shown as fold change compared to control (no IFN) based on absolute copy numbers. (F) Results of the arrayed human ISG screen. HEK293T-TIM1 target cells (p1) were pre-transfected with plasmids expressing individual ISGs together with EBOV RNP components and Firefly transfection control, and infected with EBOV trVLPs 24 hours later. Supernatants from p1 cells were harvested 24 hours post-infection and used to infect p2 target cells pre-transfected solely with vRNP components and pFluc. EBOV trVLP reporter activities for p1 (blue dots) and p2 target cells (red dots) were measured as in (B). Each dot represents one ISG. Infectivity measured for each ISG-expressing well was normalized to the activity of Fluc control within the well, and values are represented as percentage of the screen plate average, which is indicated as log of 100%. (G) Confirmatory assays for selected top candidate inhibitory ISGs. EBOV-trVLP infection was performed on HEK293T-TIM1 cells as in the primary screen. Normalized reporter activities for p1 (upper panels) and p2 target cells (lower panels) are represented as percentage of EBOV trVLP replication on cells transfected with GFP (white bars). (H) Relative quantification of intracellular (left and middle panels) and supernatant (right panel) viral RNA levels on HEK293T-TIM1 target cells (p1) transfected with EBOV RNP components and the top inhibitory ISG candidates and infected as before. cDNA synthesis and RT-qPCR analysis performed as in (D) and (E). All the represented EBOV trVLP Rluc reporter activities are normalized to control Fluc values obtained in the same lysates. Universal Type I IFN-α was used to pre-treat cells in panels (B-E). *p > 0.05, **p > 0.01 and ***p > 0.001 as determined by two-tailed paired t-test. All error bars represent ± SEM of at least three independent experiments.

