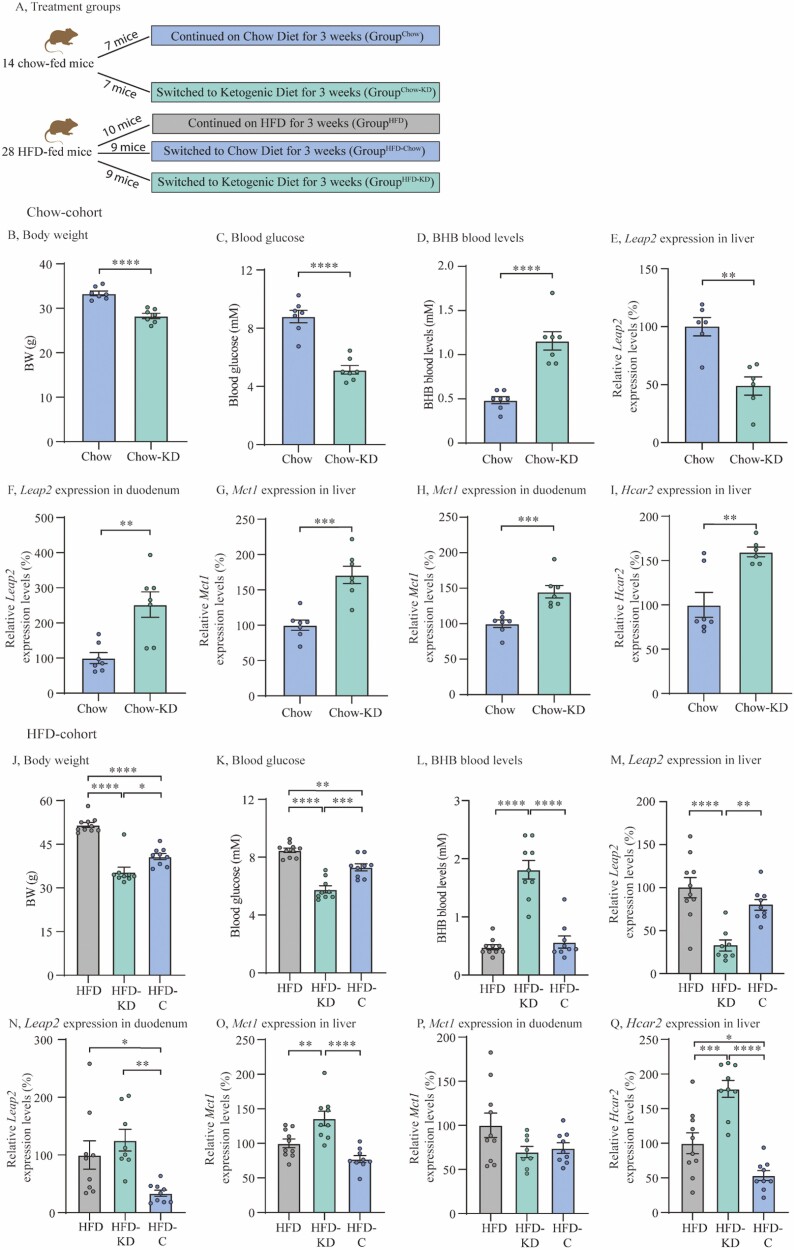
Figure 3.
Ketogenic diet downregulates Leap2 expression in mouse liver. (A) Treatment groups, (B) BW in chow-cohort, (C) Blood glucose levels in chow-cohort, (D) BHB blood levels in chow-cohort, (E) Relative Leap2 expression levels in liver in chow-cohort, (F) Relative Leap2 expression levels in duodenum in chow-cohort (G) Relative Mct1 expression levels in liver in chow-cohort, (H) Relative Mct1 expression levels in duodenum in chow-cohort, (I) Relative Hcar2 expression levels in liver in chow-cohort, (J) BW in HFD-cohort, (K) Blood glucose levels in HFD-cohort, (L) BHB blood levels in HFD-cohort, (M) Relative Leap2 expression levels in liver in HFD-cohort, (N) Relative Leap2 expression levels in duodenum in HFD-cohort, (O) Relative Mct1 expression levels in liver in HFD-cohort, (P) Relative Mct1 expression levels in in duodenum in HFD-cohort, (Q) Relative Hcar2 expression levels in in liver in HFD-cohort. Data were normalized to reference gene Ywhaz and subsequently normalized to either chow or HFD control (E-I and M-Q, respectively). Data were analyzed by unpaired t test (B-I), and one-way ANOVA followed by Tukey post hoc test (J-Q). GroupChow, n = 7; GroupChow-KD, n = 7; GroupHFD, n = 10; GroupHFD-KD, n = 9; GroupHFD-Chow n = 9. Outliers were identified and exclusion of outlier did not diverge from the results of the main analysis and result (E, I, M, N, P). * P < 0.05; ** P < 0.01; *** P < 0.001; **** P < 0.0001. Abbreviations: BHB; beta-hydroxybutyrate, HFD; high-fat diet, Leap2; Liver-expressed antimicrobial peptide 2.

