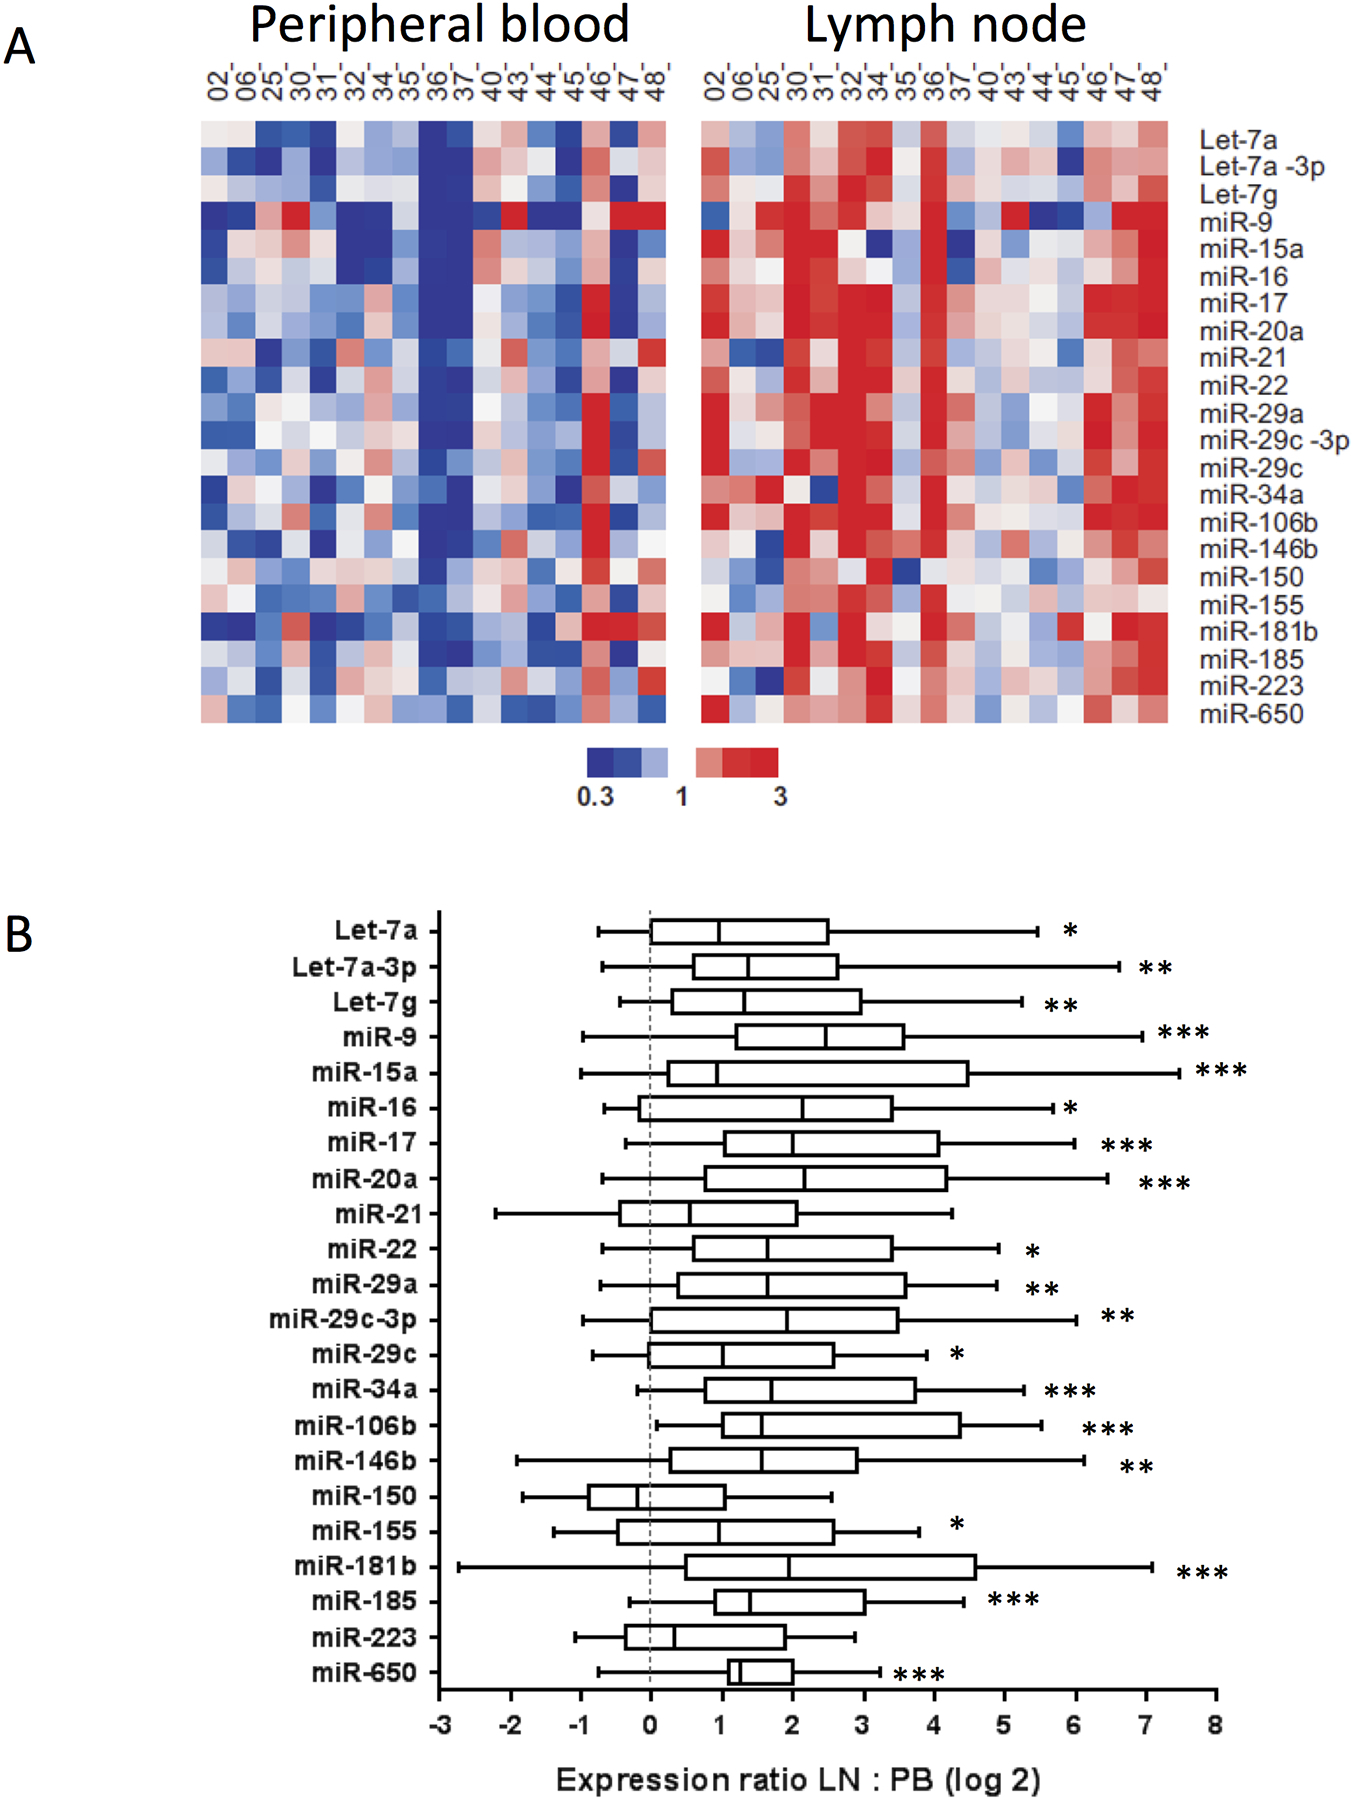
Figure 1. miRNA levels are higher in CLL cells resident in the LN than in CLL cells in the PB.

The expression levels of 22 miRNAs were assayed by TaqMan qPCR in duplicate in 17 paired, CD19+ selected CLL cells obtained concurrently from LN and PB of the same patients. (a) Heat map shows median centered expression of each miRNA across all samples graded according to the color scale shown. (b) Box plots show median and interquartile range for each miRNA. P values were calculated by the Wilcoxon paired test. *, p < 0.05, **, p < 0.01; ***, p < 0.001.
