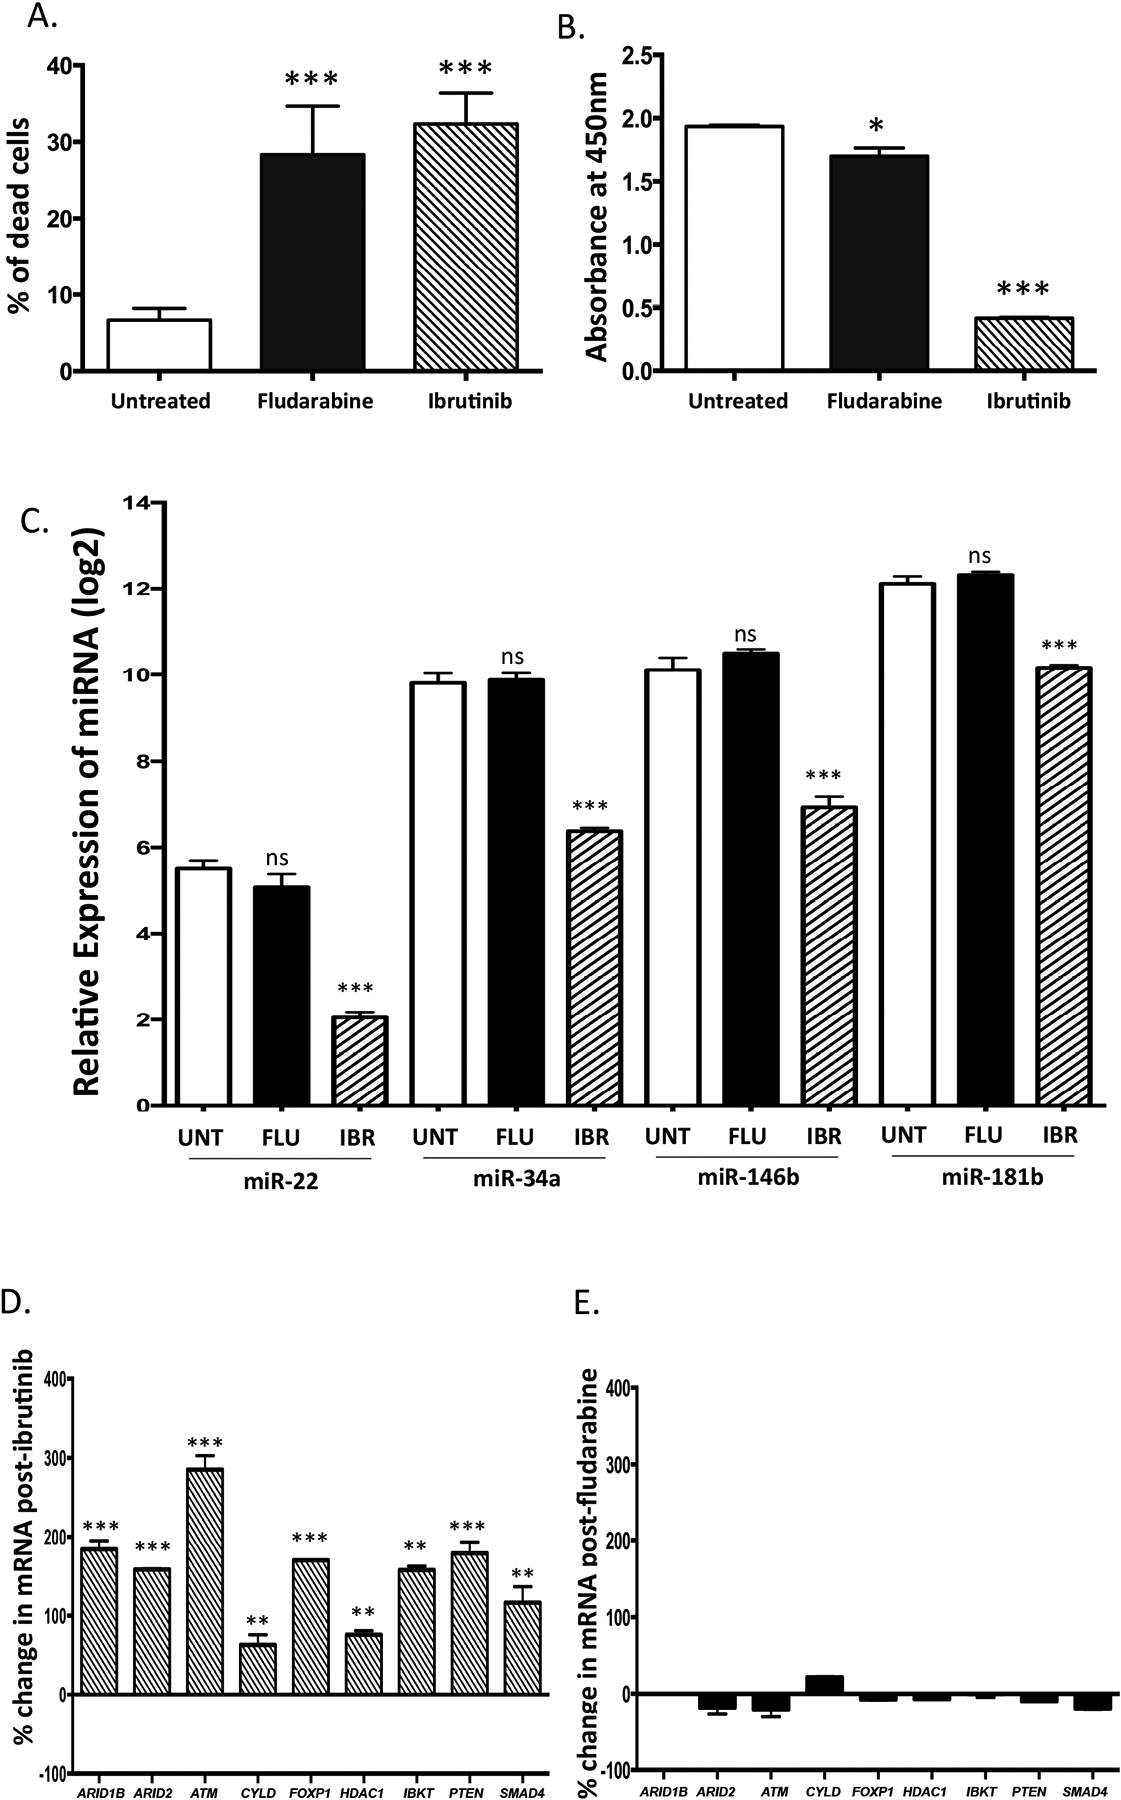
Figure 4. Down-regulation of miRNAs (miR-22, miR-34a, miR-146b, and miR-181b), and up-regulation of putative miRNA target tumor suppressors is seen by treatment with ibrutinib and not with fludarabine.

SP53 cells were treated separately with 1 μM of ibrutinib or 1 μM of fludarabine for 48 hours. Mean and standard deviation are shown. (a) The percentage of dead cells is significantly increased by both ibrutinib and fludarabine as enumerated by trypan blue staining. (b) Cell proliferation was markedly decreased with ibrutinib (p < 0.0001), and minimally decreased with fludarabine (p = 0.045) treated cells as measured by the WST assay. (c) The relative expression of miR-22, miR-34a, miR-146b, and miR-181b was significantly decreased in ibrutinib treated cells (p < 0.001) but not in fludarabine treated cells (p > 0.05) as assessed by qPCR in triplicate and compared to basal levels in untreated cells. (d) Putative miRNA targets were significantly altered in response to ibrutinib, (E) but not to fludarabine. The expression of miRNA targets was assessed by qPCR performed in triplicate. P values were calculated by the Student’s t-test. *, p < 0.05, **, p < 0.01; ***, p < 0.001. FLU, fludarabine treatment IBR, ibrutinib treatment;; ns, not significant; UNT untreated.
