
Figure 3.
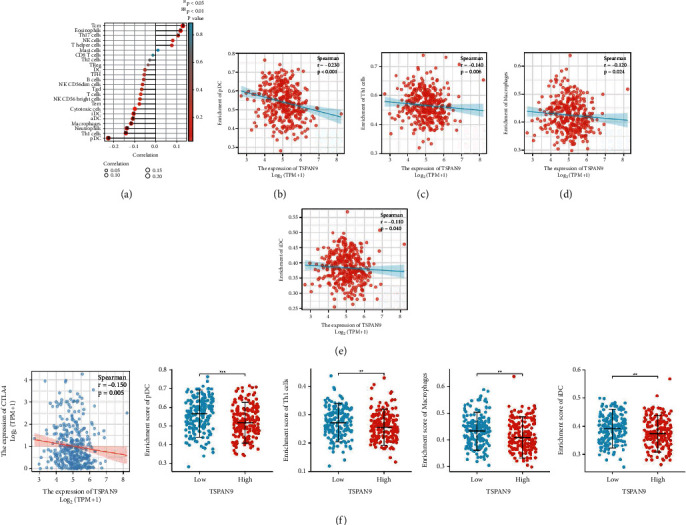
The TSPAN9 correlation analysis on the indexes of immune cell infiltration and immune checkpoint. (a) A lollipop diagram on the correlation and the correlation degree of TSPAN9 and the multiple immune cell infiltration in HCC. (b–e) The correlation of TSPAN9 with pDC (b), Th1 cell (c), macrophage (d), and iDC (e) infiltration level. (f) The expression correlation of TSPAN9 and CTLA4.