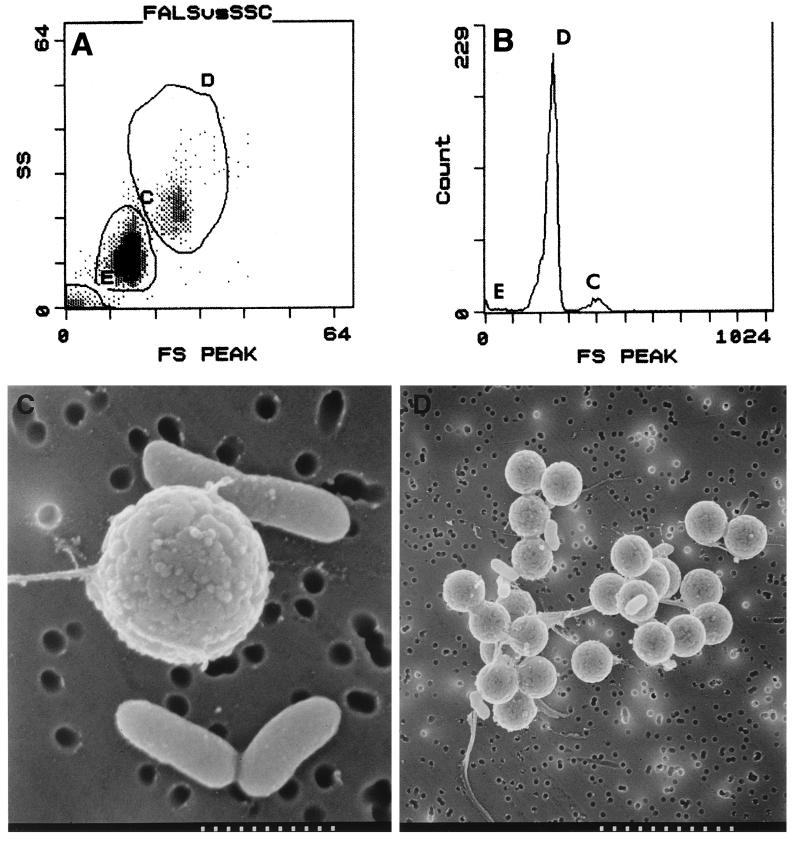
FIG. 3.
(A) Two-parameter dot plot of forward scatter and side scatter for a pure culture of E. coli O157:H7 (107 CFU/ml) labeled with fluorescent bacteriophage LG1. There are three regions. Region D (large circle) contains large aggregates of magnetic beads and E. coli O157:H7 cells; region C (small circle) contains mainly unbound magnetic beads; and region E contains cellular debris. (B) One-parameter histogram of green fluorescence data for a pure culture of E. coli O157:H7 (107 CFU/ml) labeled with fluorescent bacteriophage LG1. There are two main peaks of fluorescence. Region D exhibits the most fluorescence, followed by region C, which exhibits little fluorescence. Region E is not fluorescent. (C and D) Scanning electron micrographs of E. coli O157:H7 cells attached to immunomagnetic beads. (C) E. coli O157:H7 cells attached to a single bead. Bar = 2 μm. Magnification, ×12,600. (D) E. coli O157:H7 cells and immunomagnetic beads forming a large complex. Bar = 8.6 μm. Magnification, ×2,940.

