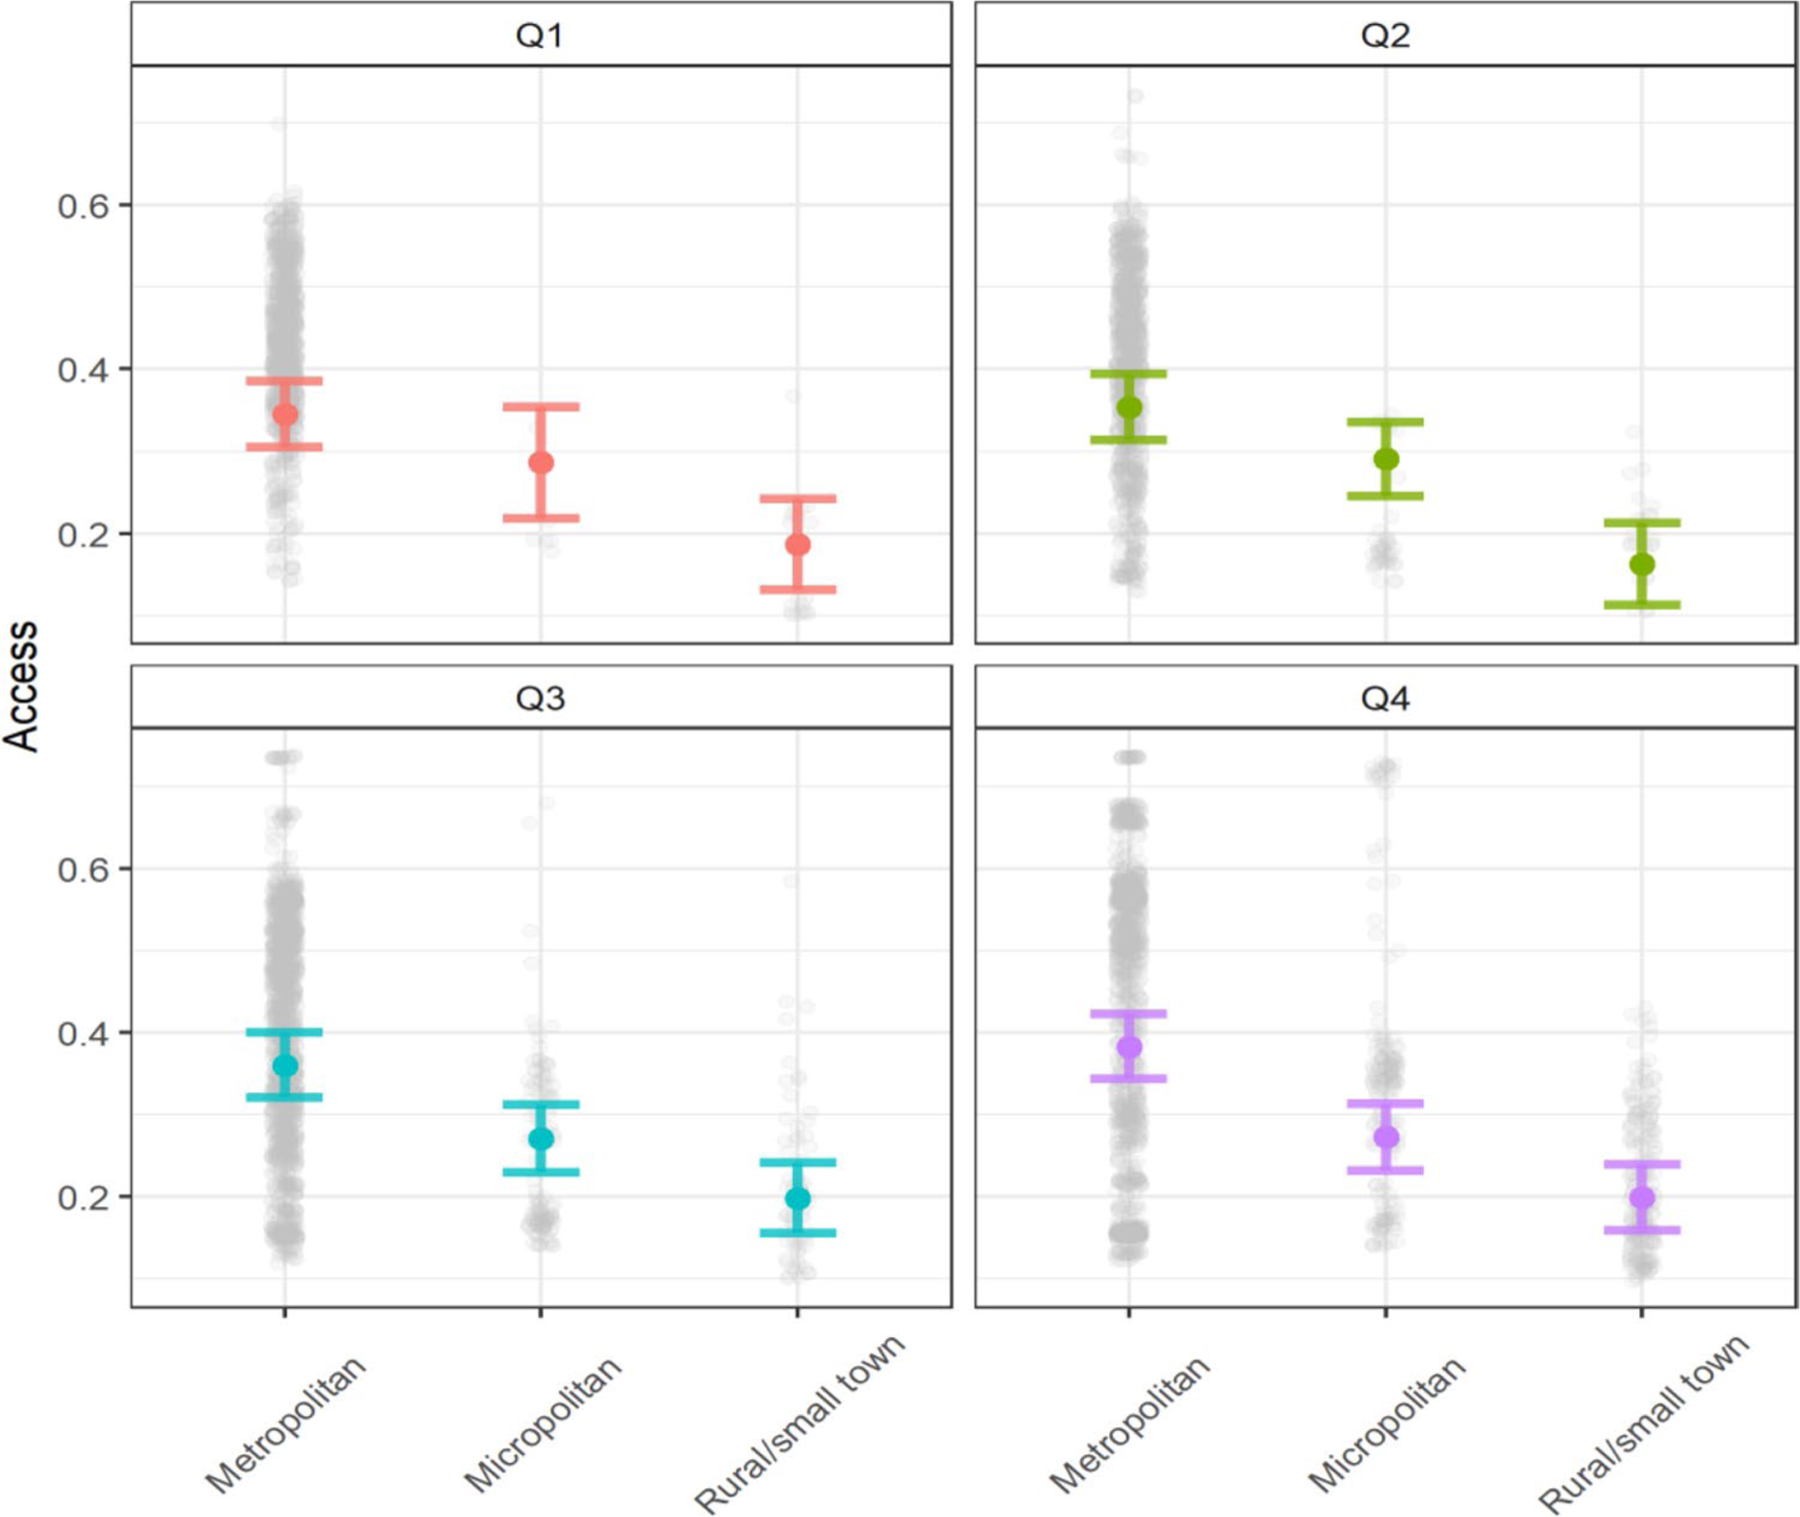
Fig. 2.

The differential association between access and rurality across socioeconomic neighborhood deprivation quartiles (Q1 is least deprived and Q4 is most deprived) from model predictions. Estimates are adjusted for a neighborhood with Hispanic proportion of 11.43% and Black/African American proportion of 3.47%, the average proportions
