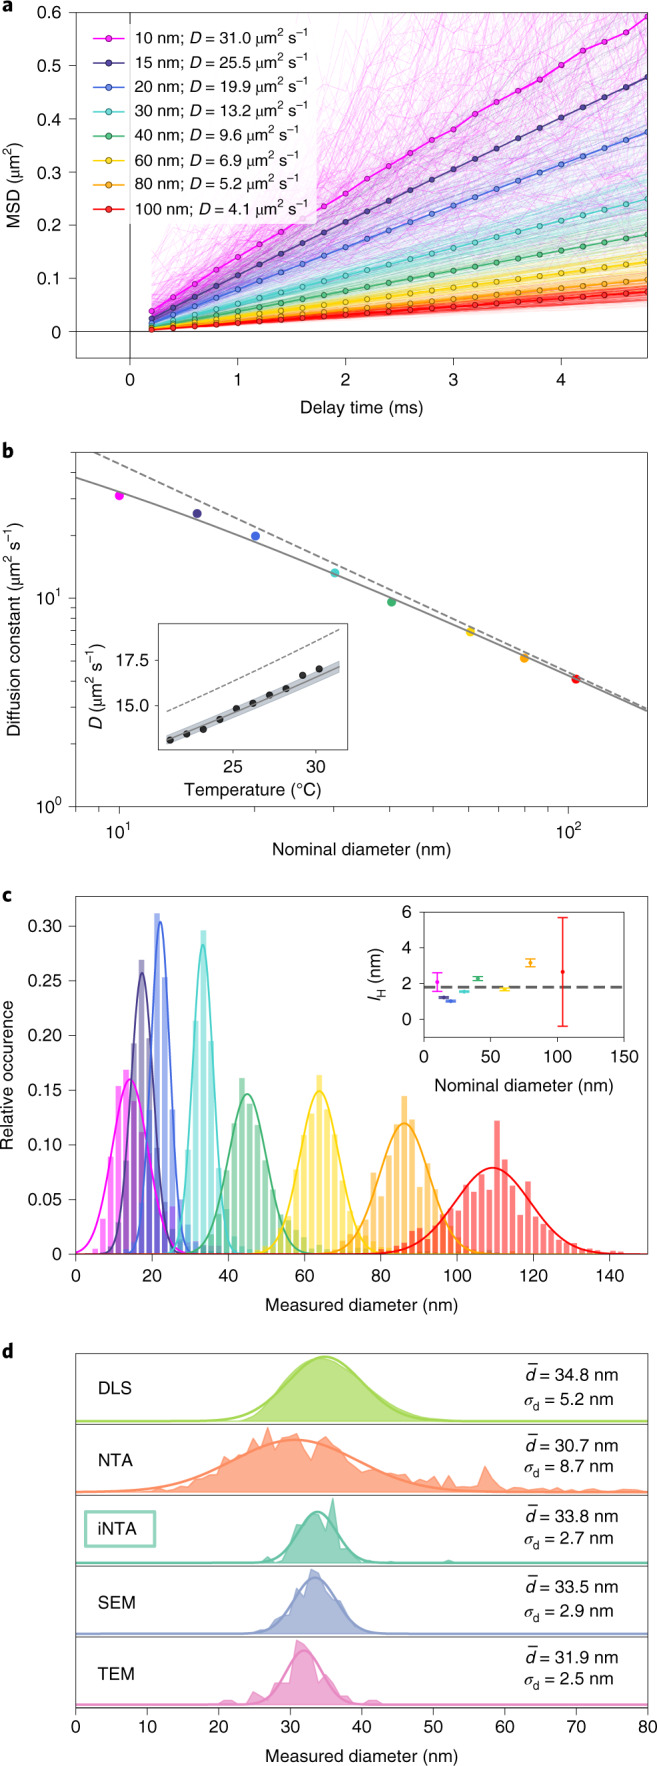
Fig. 2. Monodisperse particle samples.

a, MSD versus delay time for GNP samples of different sizes. Thin lines show the MSD extracted from each individual trajectory. Thick lines show the weighted average (by trajectory length). Diffusion constants extracted from the fits are listed in the legend. b, Diffusion constants extracted from the data in a versus the nominal GNP diameter provided by the manufacturer. Dashed gray line indicates the SE relation for T = 21 °C. Solid line is a fit to the SE relation yielding an offset in particle radius by the hydration layer thickness of lH = 1.8 ± 0.3 nm. Inset: diffusion constants for 30 nm GNPs at different temperatures. The solid line shows the prediction of equation (1) for lH = 1.8 nm. The shaded area indicates the 95% confidence interval for lH of ± 0.3 nm. Dashed line shows the outcome of SE for nom. c, Histograms of particle diameters extracted from the SE relation. Individual measurements were weighed by their trajectory lengths (Supplementary Section 3.2). The data for 10 nm, 15 nm, 20 nm and 30 nm GNPs were recorded at 40 mW illumination power; the rest were recorded at 2 mW. Inset: symbols show lH and its error bars as defined in Table 1. Dashed line indicates the value of lH obtained from the global fit in b. d, Comparison between different measurement techniques. The output of DLS measurements represents the number-weighted distribution.
