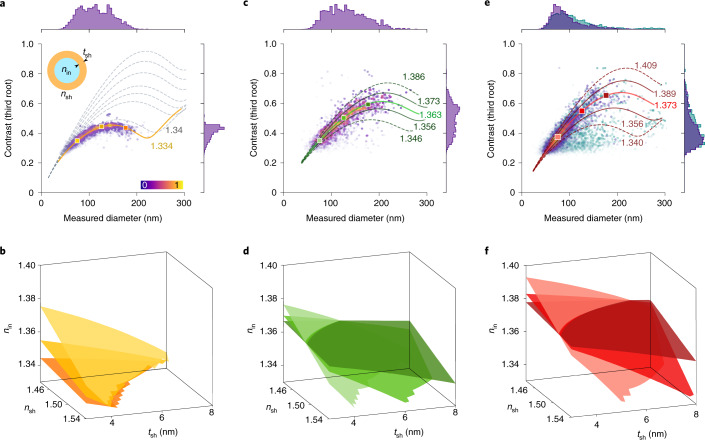
Fig. 4. Extracellular vesicles.
a, iNTA scatter plots of synthetically produced liposomes. Color bar denotes point density. The gray dashed contours correspond to different refractive indices of the inner part of the liposomes, starting at 1.334 (water) and increasing in steps of 0.02 from 1.34 for nsh = 1.48 and tsh = 5.7 nm. Inset: cartoon of a vesicle. b, Isosurfaces of constant particle size and iSCAT contrast for the points marked in a over a range of values for nin, nsh and tsh. c, iNTA scatter plots of EVs from Leishmania parasites. The green line indicates the best fit value for nin, while the solid (dashed) olive lines indicate the 25th and 75th (10th and 90th) percentiles of the extracted nin. d, Same as b but for the points marked in c. e, iNTA scatter plots of EVs from urine of a healthy human donor. The red line indicates the best fit value for nin, and the solid (dashed) maroon lines indicate the 25th and 75th (10th and 90th) percentiles of the extracted nin. f, Same as b but for the points marked in e. Each plot shows the outcome of one iNTA measurement performed on one sample. The results from more samples are shown in Supplementary Fig. 18.

