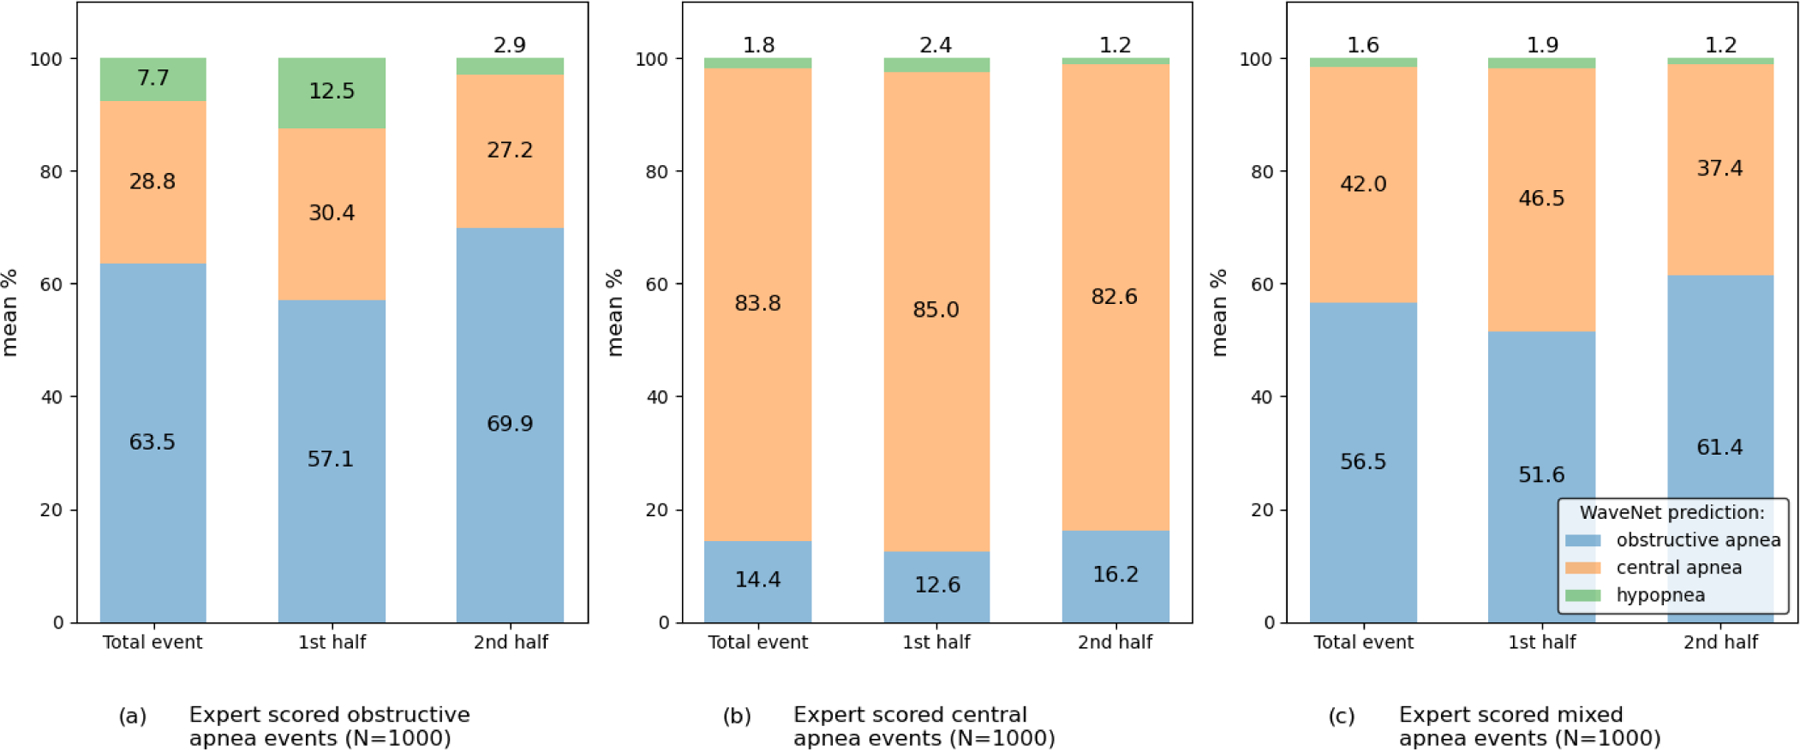
Fig. 13.

Bar plots showing the sample distribution for the WaveNet predictions for 1000 events of each of the apnea types in experiment 2. For each event type the prediction distribution among the total event is shown, together with the prediction distribution for both the first half and the second half of the manually scored event.
