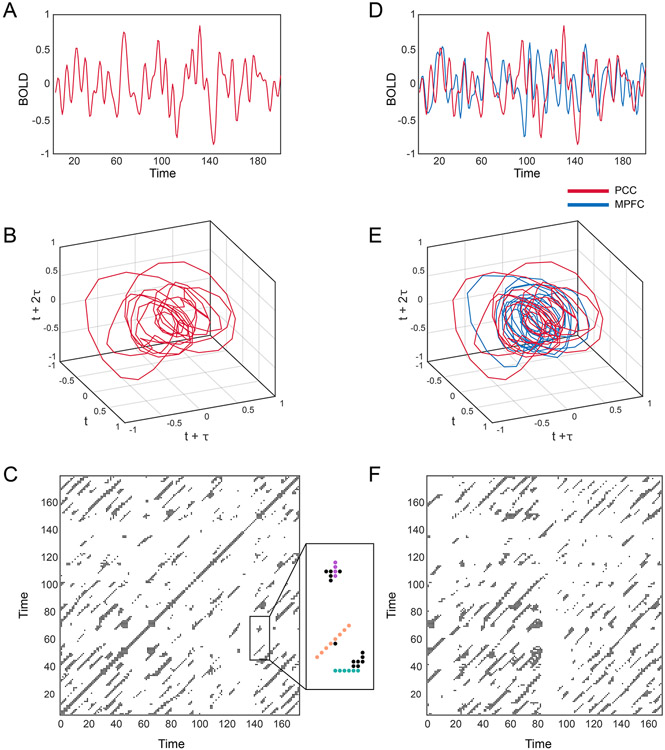
Figure 2. Construction of recurrence and cross-recurrence plots.
(A) Example BOLD signal from posterior cingulate cortex (PCC). (B) Phase portrait derived from Taken’s delay embedding of BOLD signal shown in (A). (C) Recurrence plot derived from (B). Examples of the features we quantified from recurrence plots are provided in the magnified box. Recurrence plots represent periodic processes with diagonal lines (orange dotted line) and non-periodic processes with vertical/horizontal (laminar) lines (purple/blue dotted lines). (D) Example BOLD signal from posterior cingulate cortex (PCC) (red) and medial prefrontal cortex (MPFC) (blue). (E) Phase portrait derived from Taken’s delay embedding of BOLD signals shown in (D). (F) Cross-recurrence plot derived from (E). We quantified the same features from cross-recurrence plots as recurrence plots, e.g., diagonal lines or cyclical processes.

