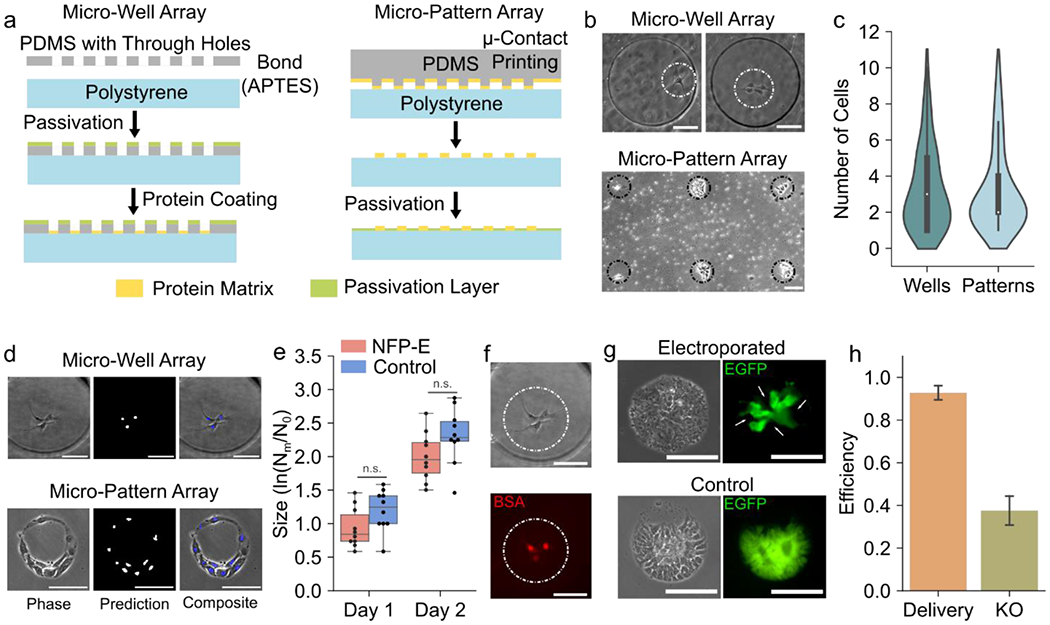
Figure 4: NFP-E and micro-confinement method for manipulation of small cell populations.

a) Schematics showing fabrication workflow for micro-well array (Left) and micro-pattern array (Right) b) Localization of a single to few cells on micro-well arrays and micro-patterned arrays c) Distribution of cells captured in micro-wells and micro-patterns. Majority of the occupied micro-confinements had 1 to 3 cells. d) Prediction of nuclear locations of hiPSCs seeded in micro-wells and micro-patterns using the FCN e) Size of control and NFP-E treated hiPSC colonies as observed over 2 days post electroporation to track the effect of electroporation on cell proliferation (N = 10 colonies for each group). The size was calculated as the logarithm of the ratio of the number of cells in a colony on a particular day (Nm) and the number of cells in the same colony on day zero (N0). (n.s.: no significant difference) f) Delivery of fluorescent BSA in hiPSCs seeded in a micro-well g) Knockout of EGFP in an hiPSC colony on a micro-pattern array observed 72 hours after Cas9/sgRNA RNP delivery. The control indicates a colony formed by non-electroporated cells. The arrows indicate knockout daughter cells originating from a single electroporated parent cell. h) Efficiency of BSA delivery (micro-well array) and EGFP knockout (micro-pattern array) in hiPSCs using the NFP-E (N = 3 experiments for both BSA delivery and EGFP knockout). Scale Bars: 100 μm, Error bars represent the S.D.
