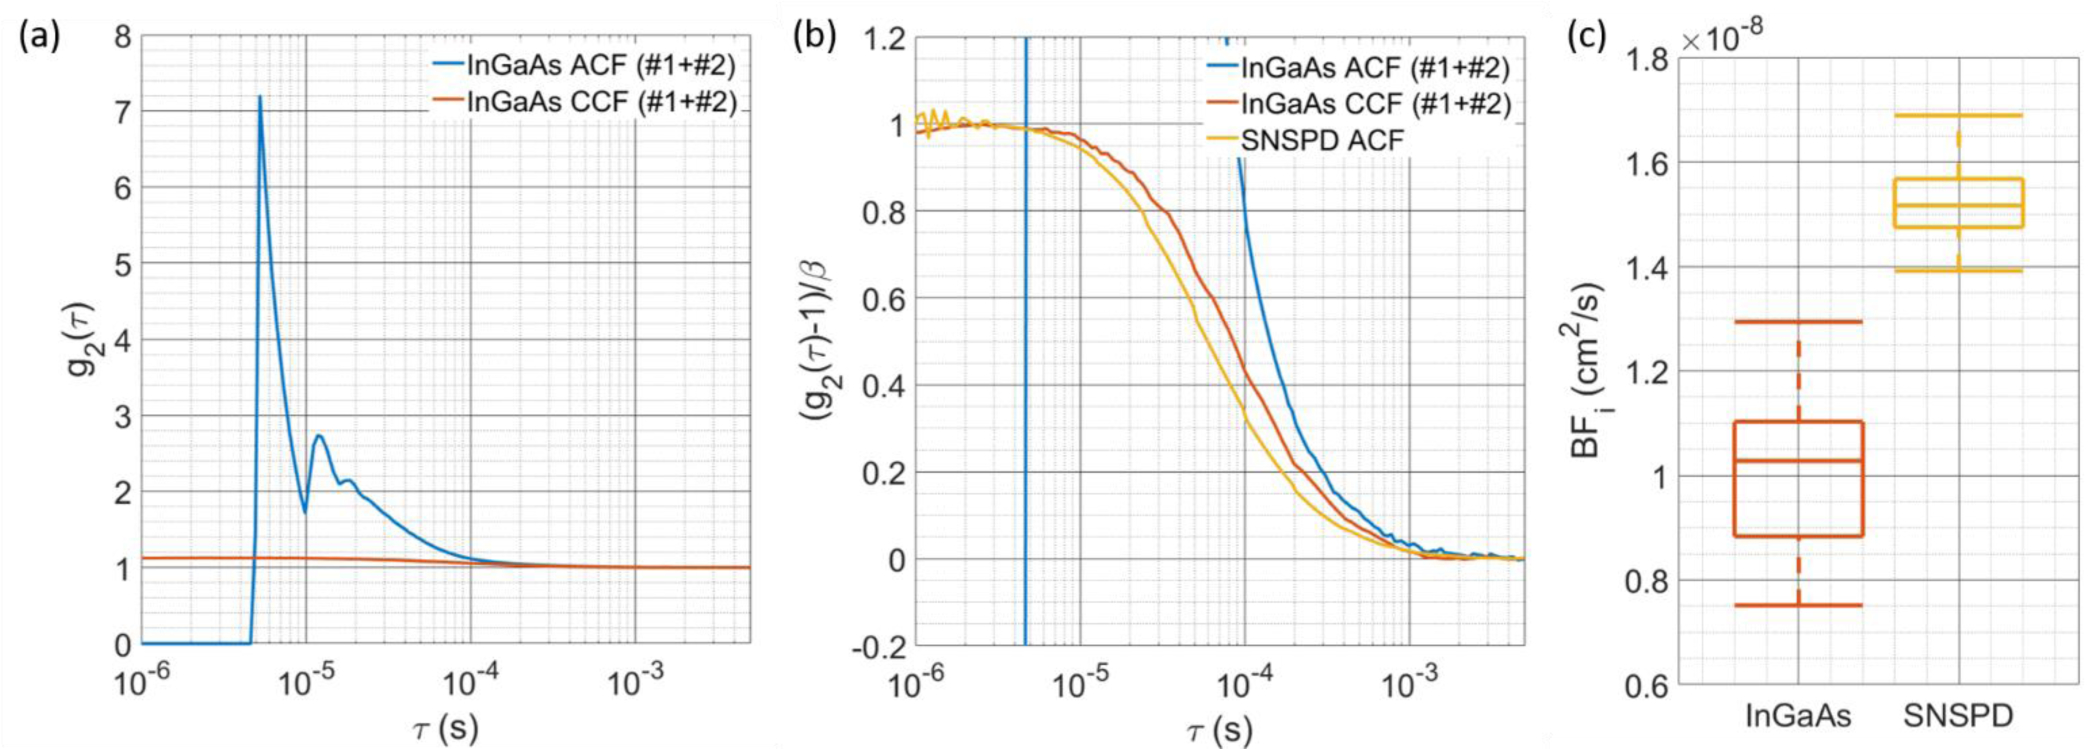
Fig. 3.

(a) Comparison of the g2(τ) calculated with autocorrelation of the combined counts of both detectors and the cross-correlation between the counts of each detector. The large artifacts due to afterpulsing are present in the autocorrelation calculation, though cross-correlation can be seen to remove the artifacts and extend the g2 to times below the hold-off time. (b) The comparison between the SNSPD autocorrelation, InGaAs/InP autocorrelation, and InGaAs/InP cross correlation shows that the cross-correlation is not completely without distortion, showing a slower decay. Quantification of this decay is shown in (c), where BFi is fit from g2(τ)’s calculated from measurements at different operating conditions. The consistently lower BFi is likely due to the “extension” of correlation by afterpulsing counts.
