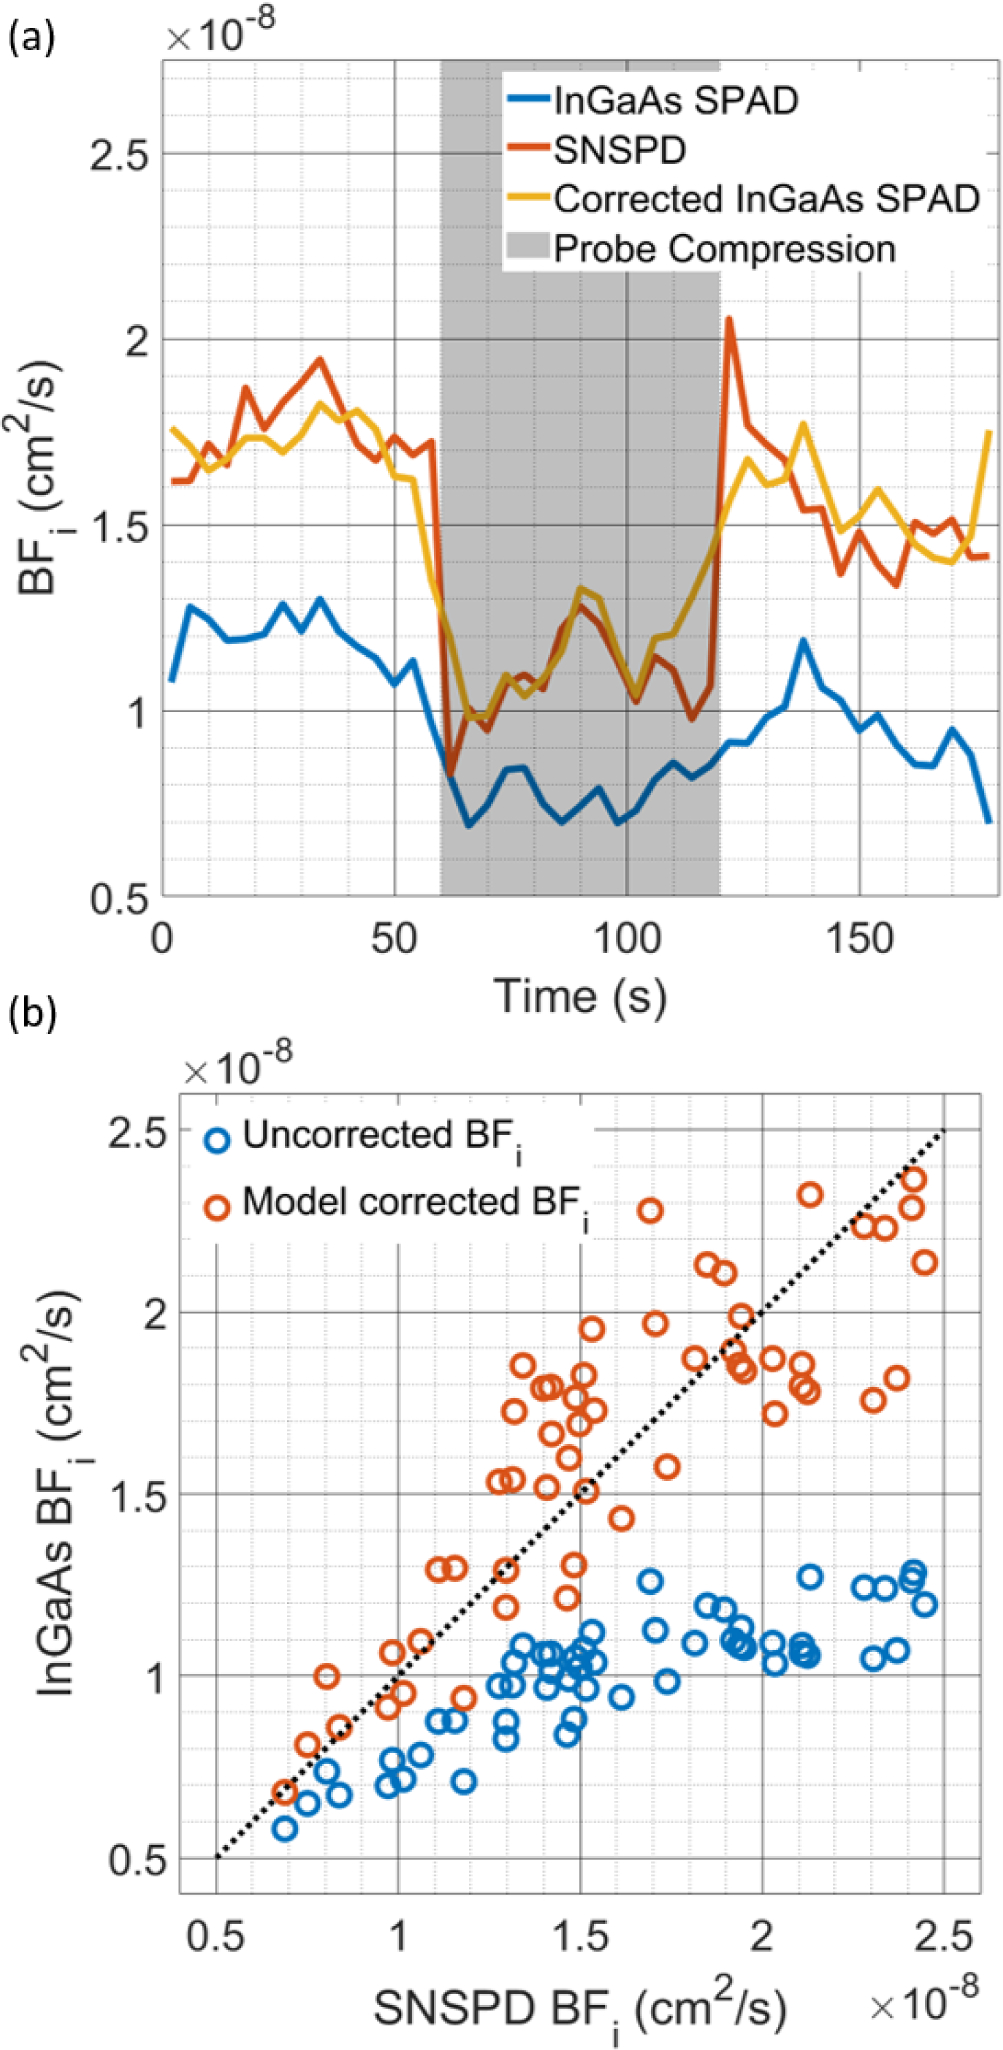
Fig. 6.

(a) Comparison of the time course of fitted BFi during the probe compression protocol. The effect of the afterpulsing on the BFi is seen in the lower BFi fitted for the uncorrected data, but following correction, the InGaAs/InP detector cross-correlation gives very similar results to that of the SNSPD. (b) Comparison of the BFi fitted from the SNSPD and InGaAs/InP measurements with and without the correction by the model. Large systematic errors can be seen in the estimate of BFi without correction, but the model allows the extraction of accurate BFi values. Due to the compression of the dynamic range of the autocorrelation decay at higher BFi values, the variability of the BFi estimates after correction can be seen to increase with the degree of the discrepancy between the true BFi and the naively fit BFi.
