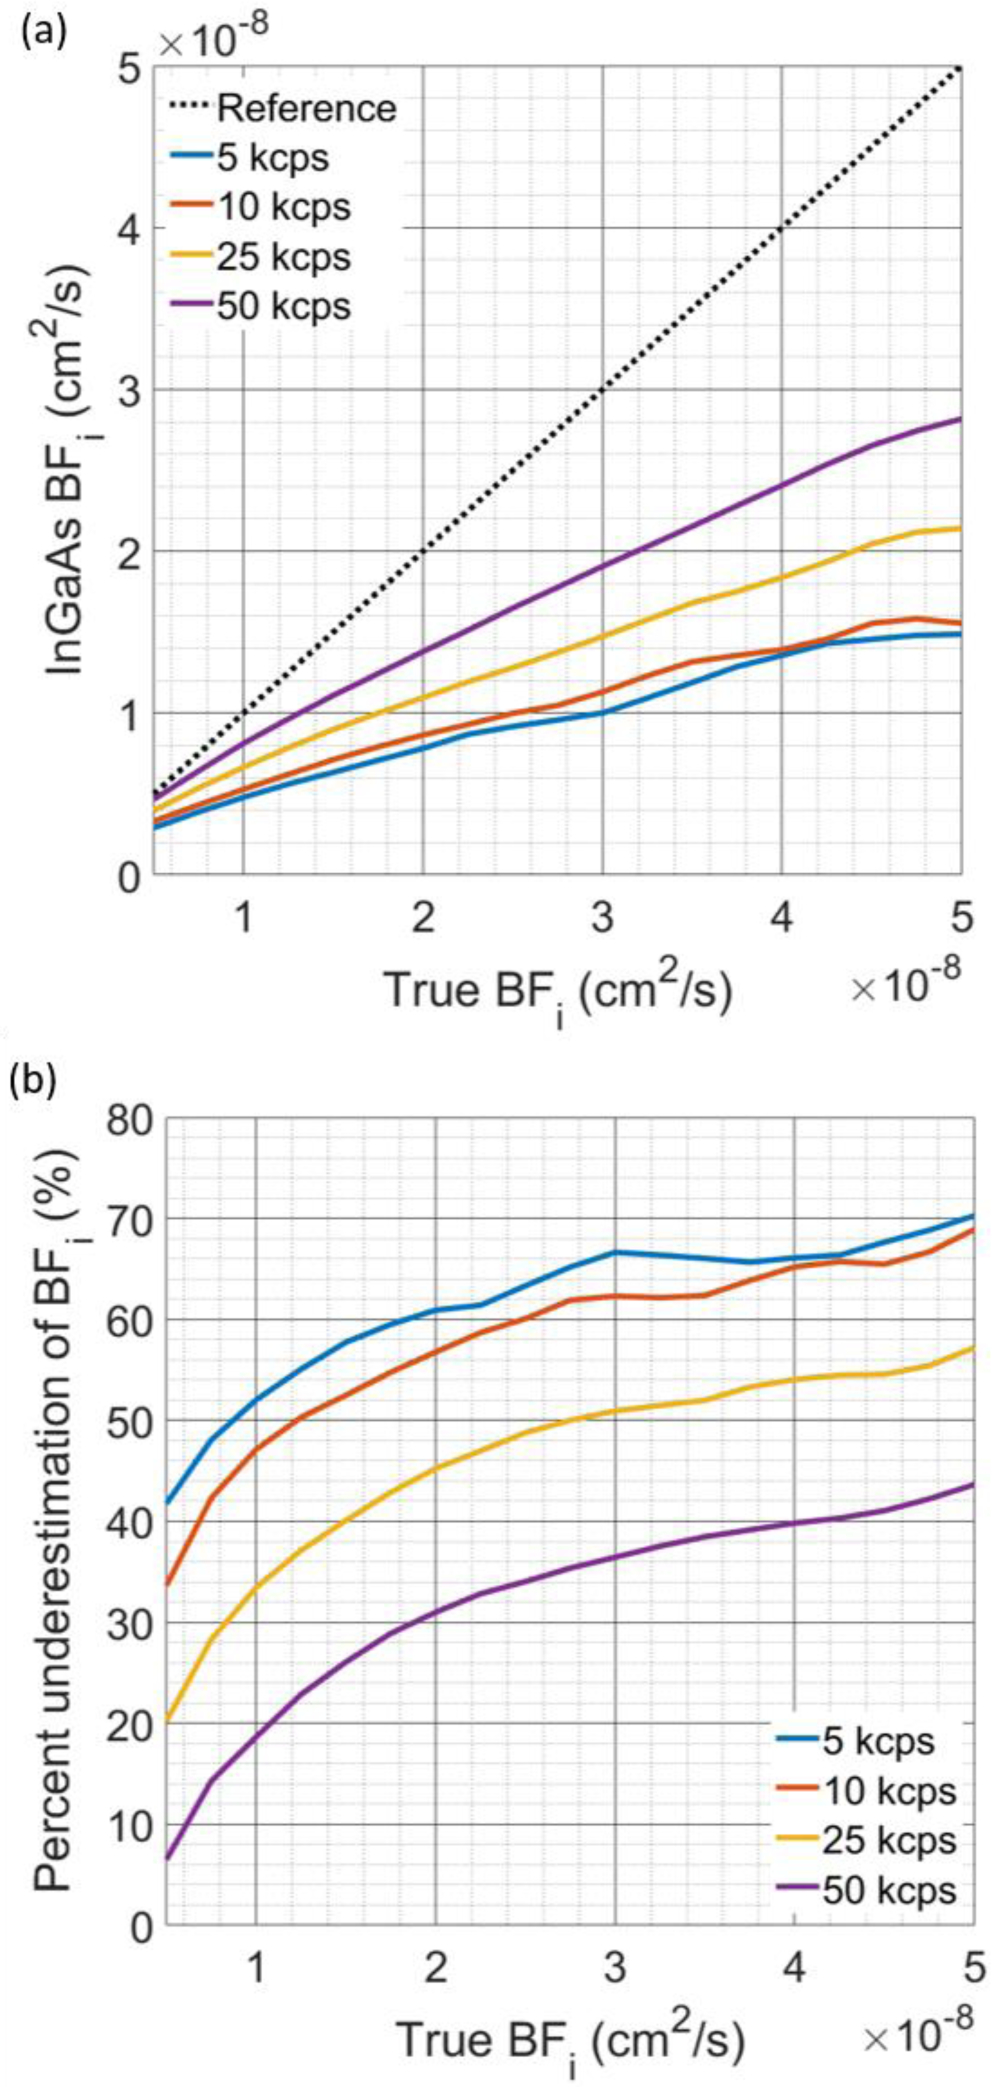
Fig. 7:

(a) Comparison of the recovered BFi from g2(τ) curves generated by the synthetic data model. The detector characteristics for each detector used for these simulations were AP0 = [180, 140] kcps, DCR = [0.25, 0.25] kcps, and α = [1.37, 1.54], as fit from the measurements made at the operating conditions used for the in vivo experiments. At low count rates, the BFi recovered from the curves shows more severe underestimation, seen in both (a) and (b), though with a higher photon count rate, the degree of underestimation is improved. The relationship shown provides a rationale for the relative BFi matching well between the InGaAs/InP measurement and the reference measurement, as these measurements were made over a relatively small range of BFi values. With an increase in the range of BFi made during a particular measurement, this accuracy would likely be degraded, as the relationship between InGaAs/InP derived BFi and true BFi is nonlinear.
