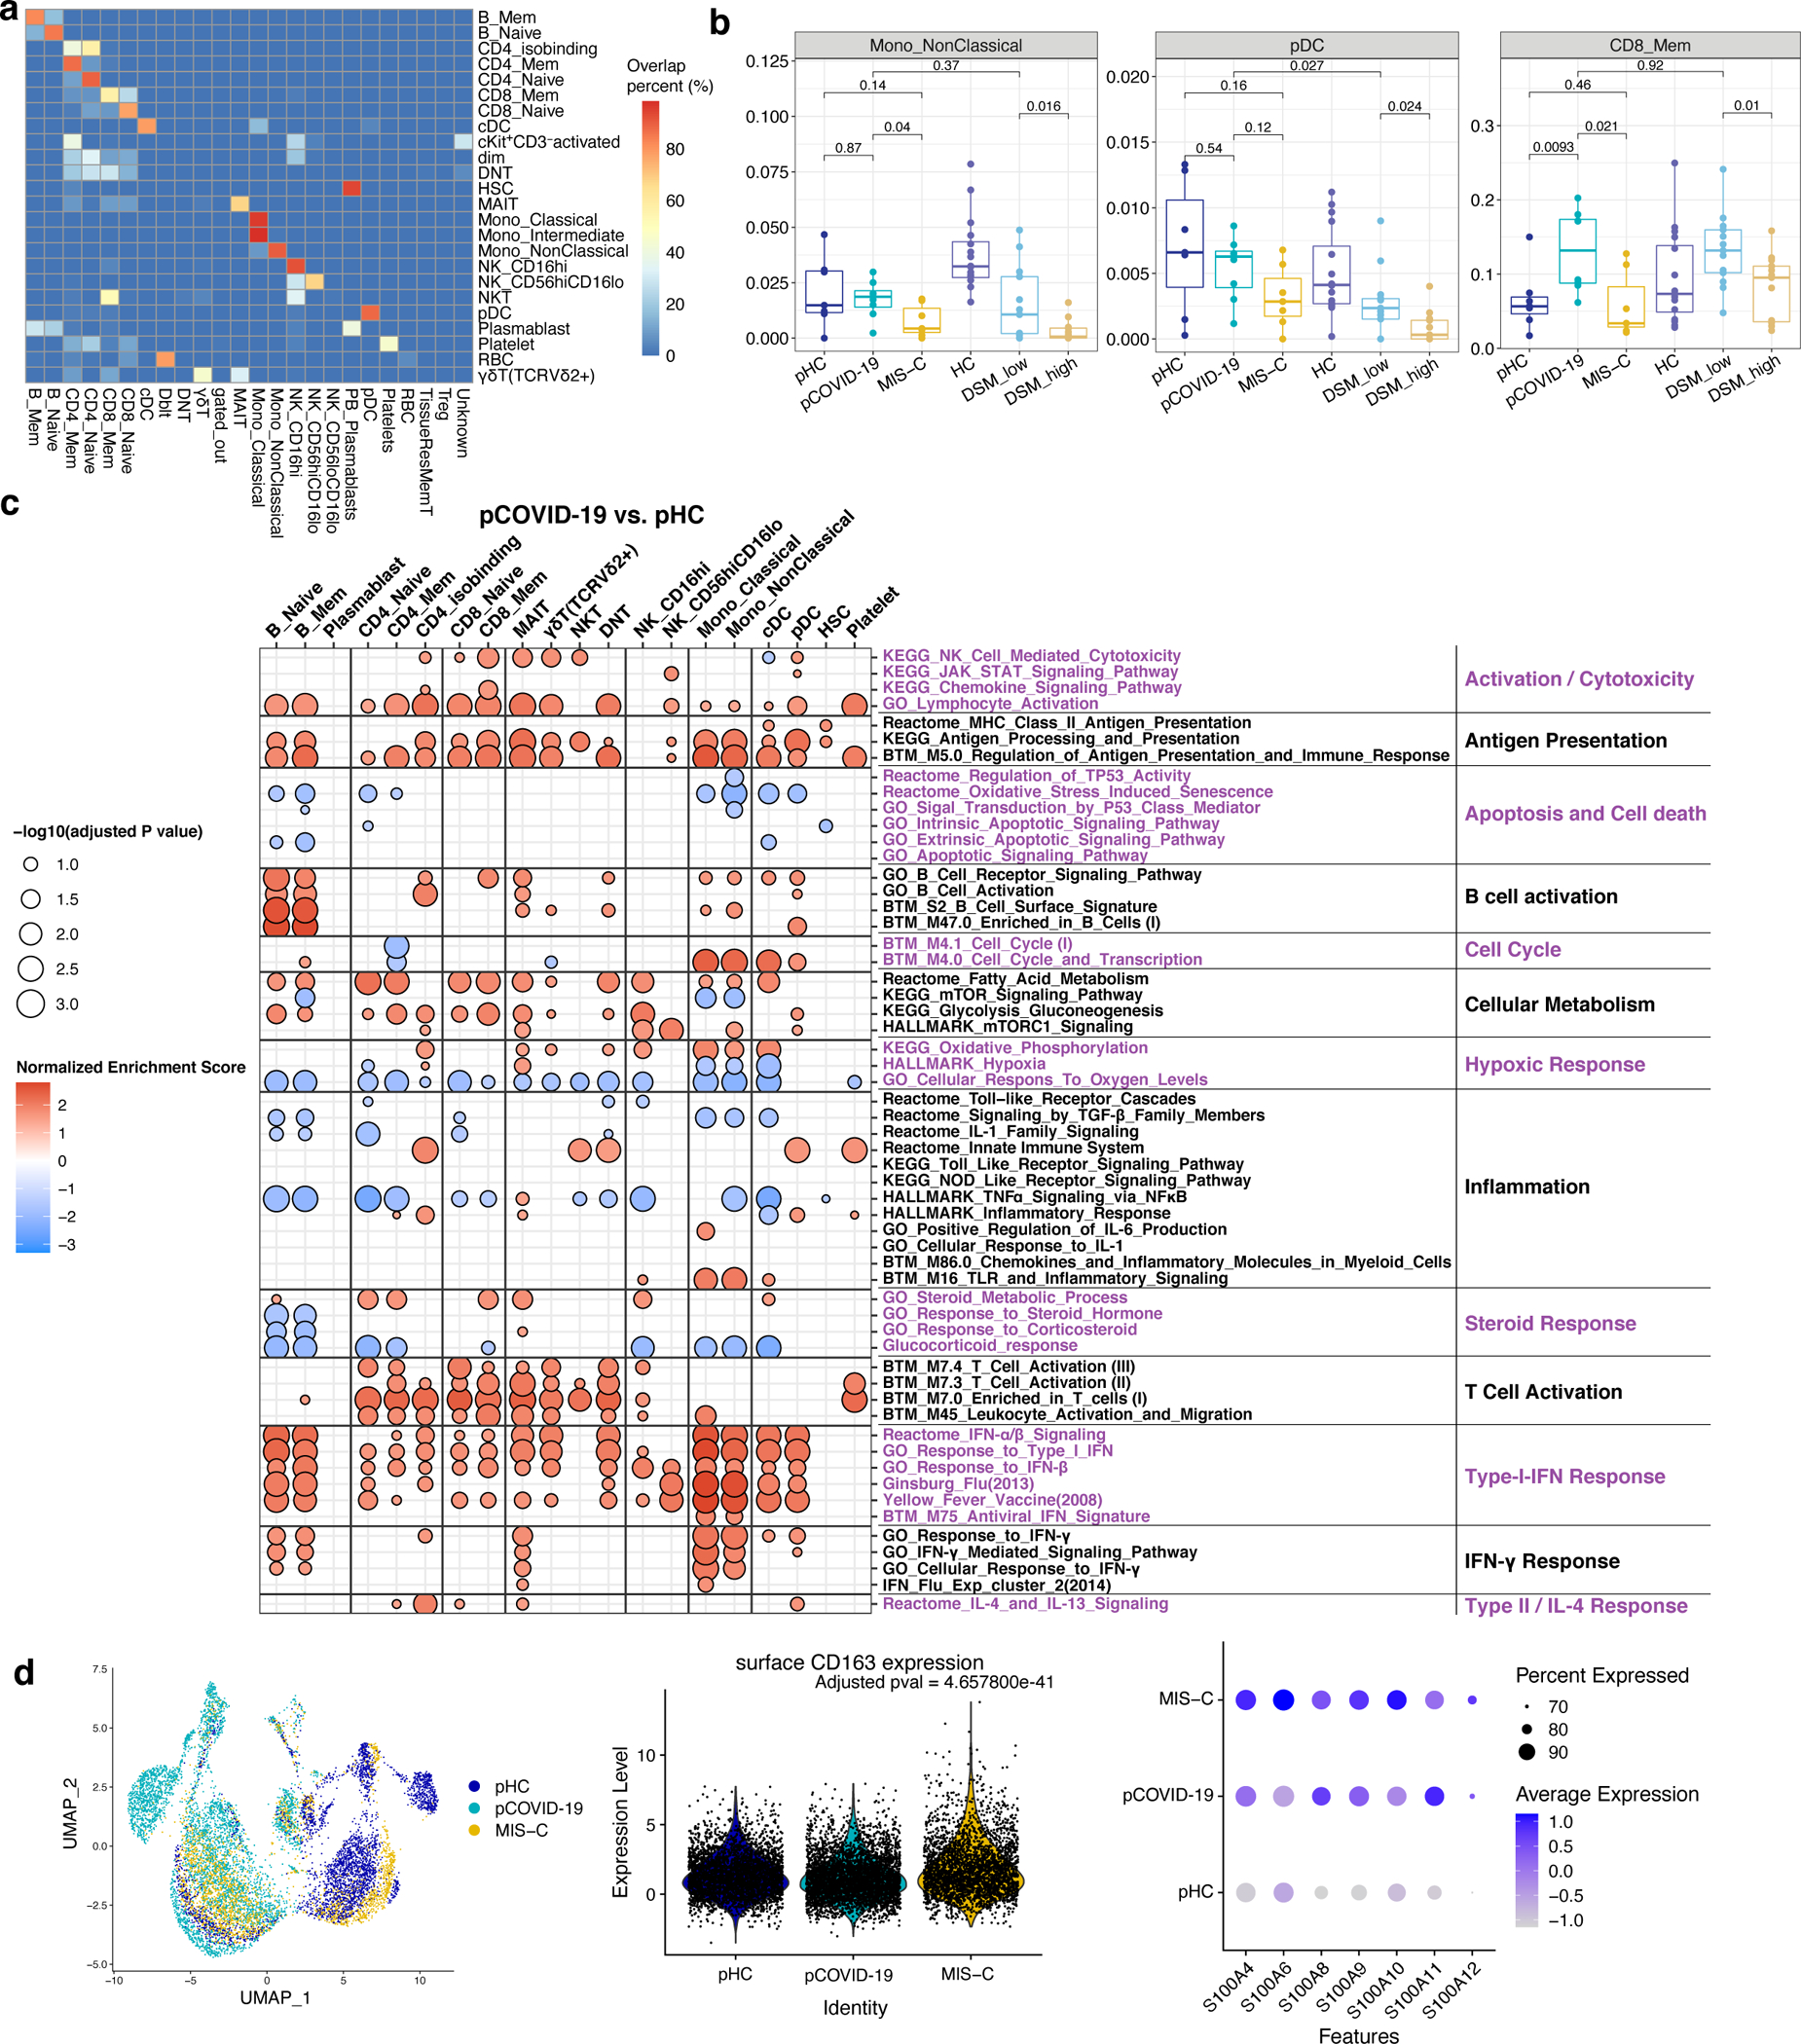
Extended Data Fig. 5: Immune cell atlas and cell-type specific gene expression profile of MIS-C and pediatric COVID-19 (pCOVID-19).

a, CITE-seq label transfer from previous adult COVID-19 experiments. Heatmap shows the overlap percentage of predicted markers from label transfer (x-axis) and annotated cell populations in this pediatric dataset (y-axis).
b, Frequencies of immune cell clusters for non-classical monocytes, plasmacytoid dendritic cells (pDC) and CD8 memory T cells in adult healthy controls (aHC, n=13), adult patients with less severe (disease severity matrix low, DSM_low, n=13) COVID-19, adult patients with more severe (DSM_high, n=13) COVID-19, pediatric HC (pHC, n=7), pediatric COVID-19 (pCOVID-19,n=8) and MIS-C patients (n=7). P values shown were obtained using two-sided Wilcoxon test between indicated two groups. Adult COVID-19 data are from Liu et al, 2021 (ref.25). To avoid potential batch effects of independently annotated adult and pediatric populations, cell frequencies of pediatric dataset shown were obtained by label transfer from adult data (See Methods and panel a). Each dot indicates a subject. Only the first timepoint from each subject is shown. Box plot elements are the same as in Figure 4e.
c, Enrichment Analysis of pCOVID-19 (n=7) vs. pHC (n=7) at timepoints within 40 days of admission. Selected gene sets are grouped into functional/pathway categories. Dot color denotes normalized gene set enrichment score and size indicates –log10(adjusted p value). P values were adjusted using the Benjamini-Hochberg method.
d, From left to right: UMAP of monocyte RNA expression clusters, surface CD163 expression (FDR adjusted p value comparing surface CD163 expression of MIS-C monocytes vs. pHC and pCOVID-19 monocytes is shown) and expression of S100A family inflammatory genes which are differentially expressed in monocytes of MIS-C versus pHC. Cells from all time points are shown (pHC, n=7; pCOVID-19, n=8; MIS-C, n=10, with two timepoints included for 3 MIS-C patients).
