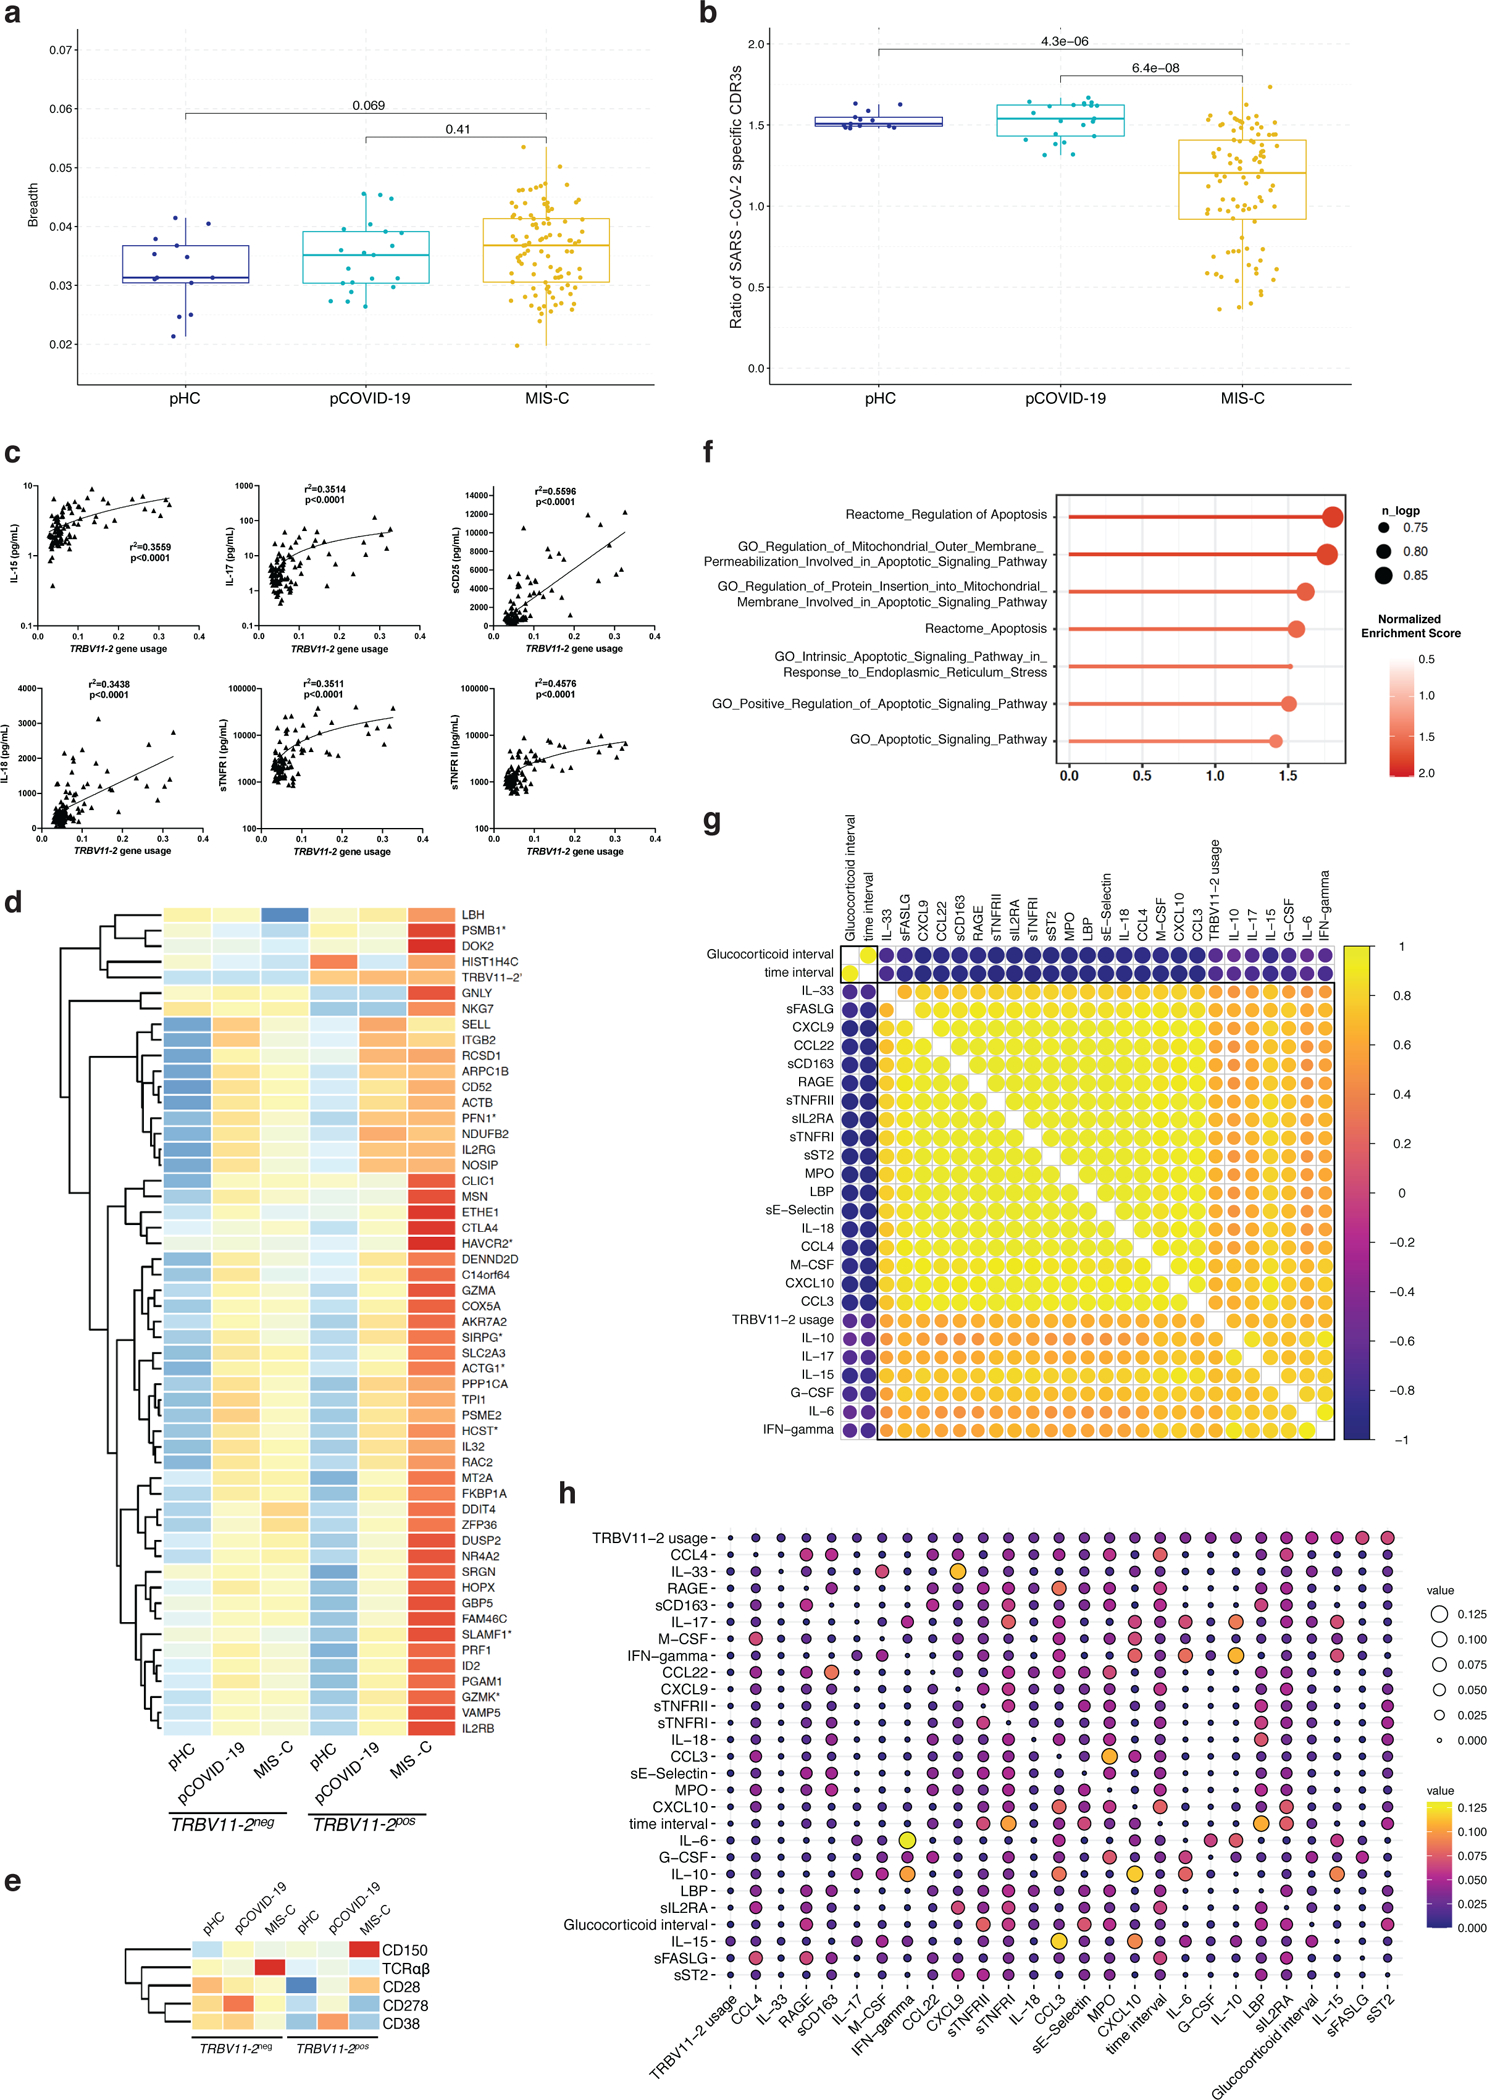
Extended Data Fig. 6: SARS-CoV-2 specific clonotypes, characteristics of TRBV11–2+ clonotypes, and correlation with soluble biomarkers.

a, Breadth of SARS-CoV-2 specific TRB clonotypes in pHC, pCOVID-19 and MIS-C patients.
b, Ratio of SARS-CoV-2 specific CDR3 clonotypes among unique TRBV11–2-positive versus TRBV11–2-negative clonotypes in pHC, pCOVID-19 and MIS-C.
c, Simple linear regression analysis, correlating frequency of TRBV11–2 clonotypes and soluble biomarker levels. R squared goodness of fit and p values are shown.
d, Gene expression of TRBV11–2 positive (TRBV11–2pos) compared to TRBV11–2 negative (TRBV11–2neg) CD4+ T cells within MIS-C samples (n=10, 3/7 patients with 2 time points). Differentially expressed genes with adjusted p value < 0.2 are marked with an asterisk (*). Scaled average gene expression level of TRBV11–2neg and TRBV11–2pos CD4+ T cells is shown in all 3 groups (pHC, pCOVID-19, and MIS-C).
e, Heatmap showing the marker genes of TRBV11–2pos MIS-C CD4+ T cells compared to TRBV11–2neg CD4+ T cells.
f, Gene set pathway enrichment analysis (GSEA) of apoptosis signature in TRBV11–2pos CD4+ T cells from MIS-C patients (n=7, 3/7 patients with 2 time points). Dot color denotes normalized gene set enrichment score and size indicates –log10(adjusted p value). P values were from GSEA test of the whole gene sets (see: Methods) and adjusted using the Benjamini-Hochberg method.
g, Pearson correlation coefficient values between indicated variables. The top 50th percentile predictors of TRBV11–2 gene usage are shown. Analysis conducted on 92 samples collected at various timepoints after hospitalization from 56 MIS-C patients who received glucocorticoids. Time interval and glucocorticoid interval are defined as days since admission and since initiation of systemic glucocorticoids, respectively.
h, Pairwise interaction strengths derived from random forest regression analysis. Columns identify predictors, and rows correspond to targets. Input data are the same as in panel f.
In panels a and b, values are for 21 samples from 21 pCOVID-19, 96 samples from 58 MIS-C, and 13 samples from 13 pHC subjects. Box plots show the median, first and third quantiles (lower and upper hinges) and smallest (lower hinge - 1.5*interquartile range) and largest values (upper hinge + 1.5* interquartile range) (lower and upper whiskers). Statistical analysis was done with two-tailed Wilcoxon test. In panels d and e, average log fold change (logFC) threshold 0.2 and p value 0.2 were used for marker gene cutoff, and P values were calculated using the Wilcoxon Rank Sum test and adjusted using FDR method.
