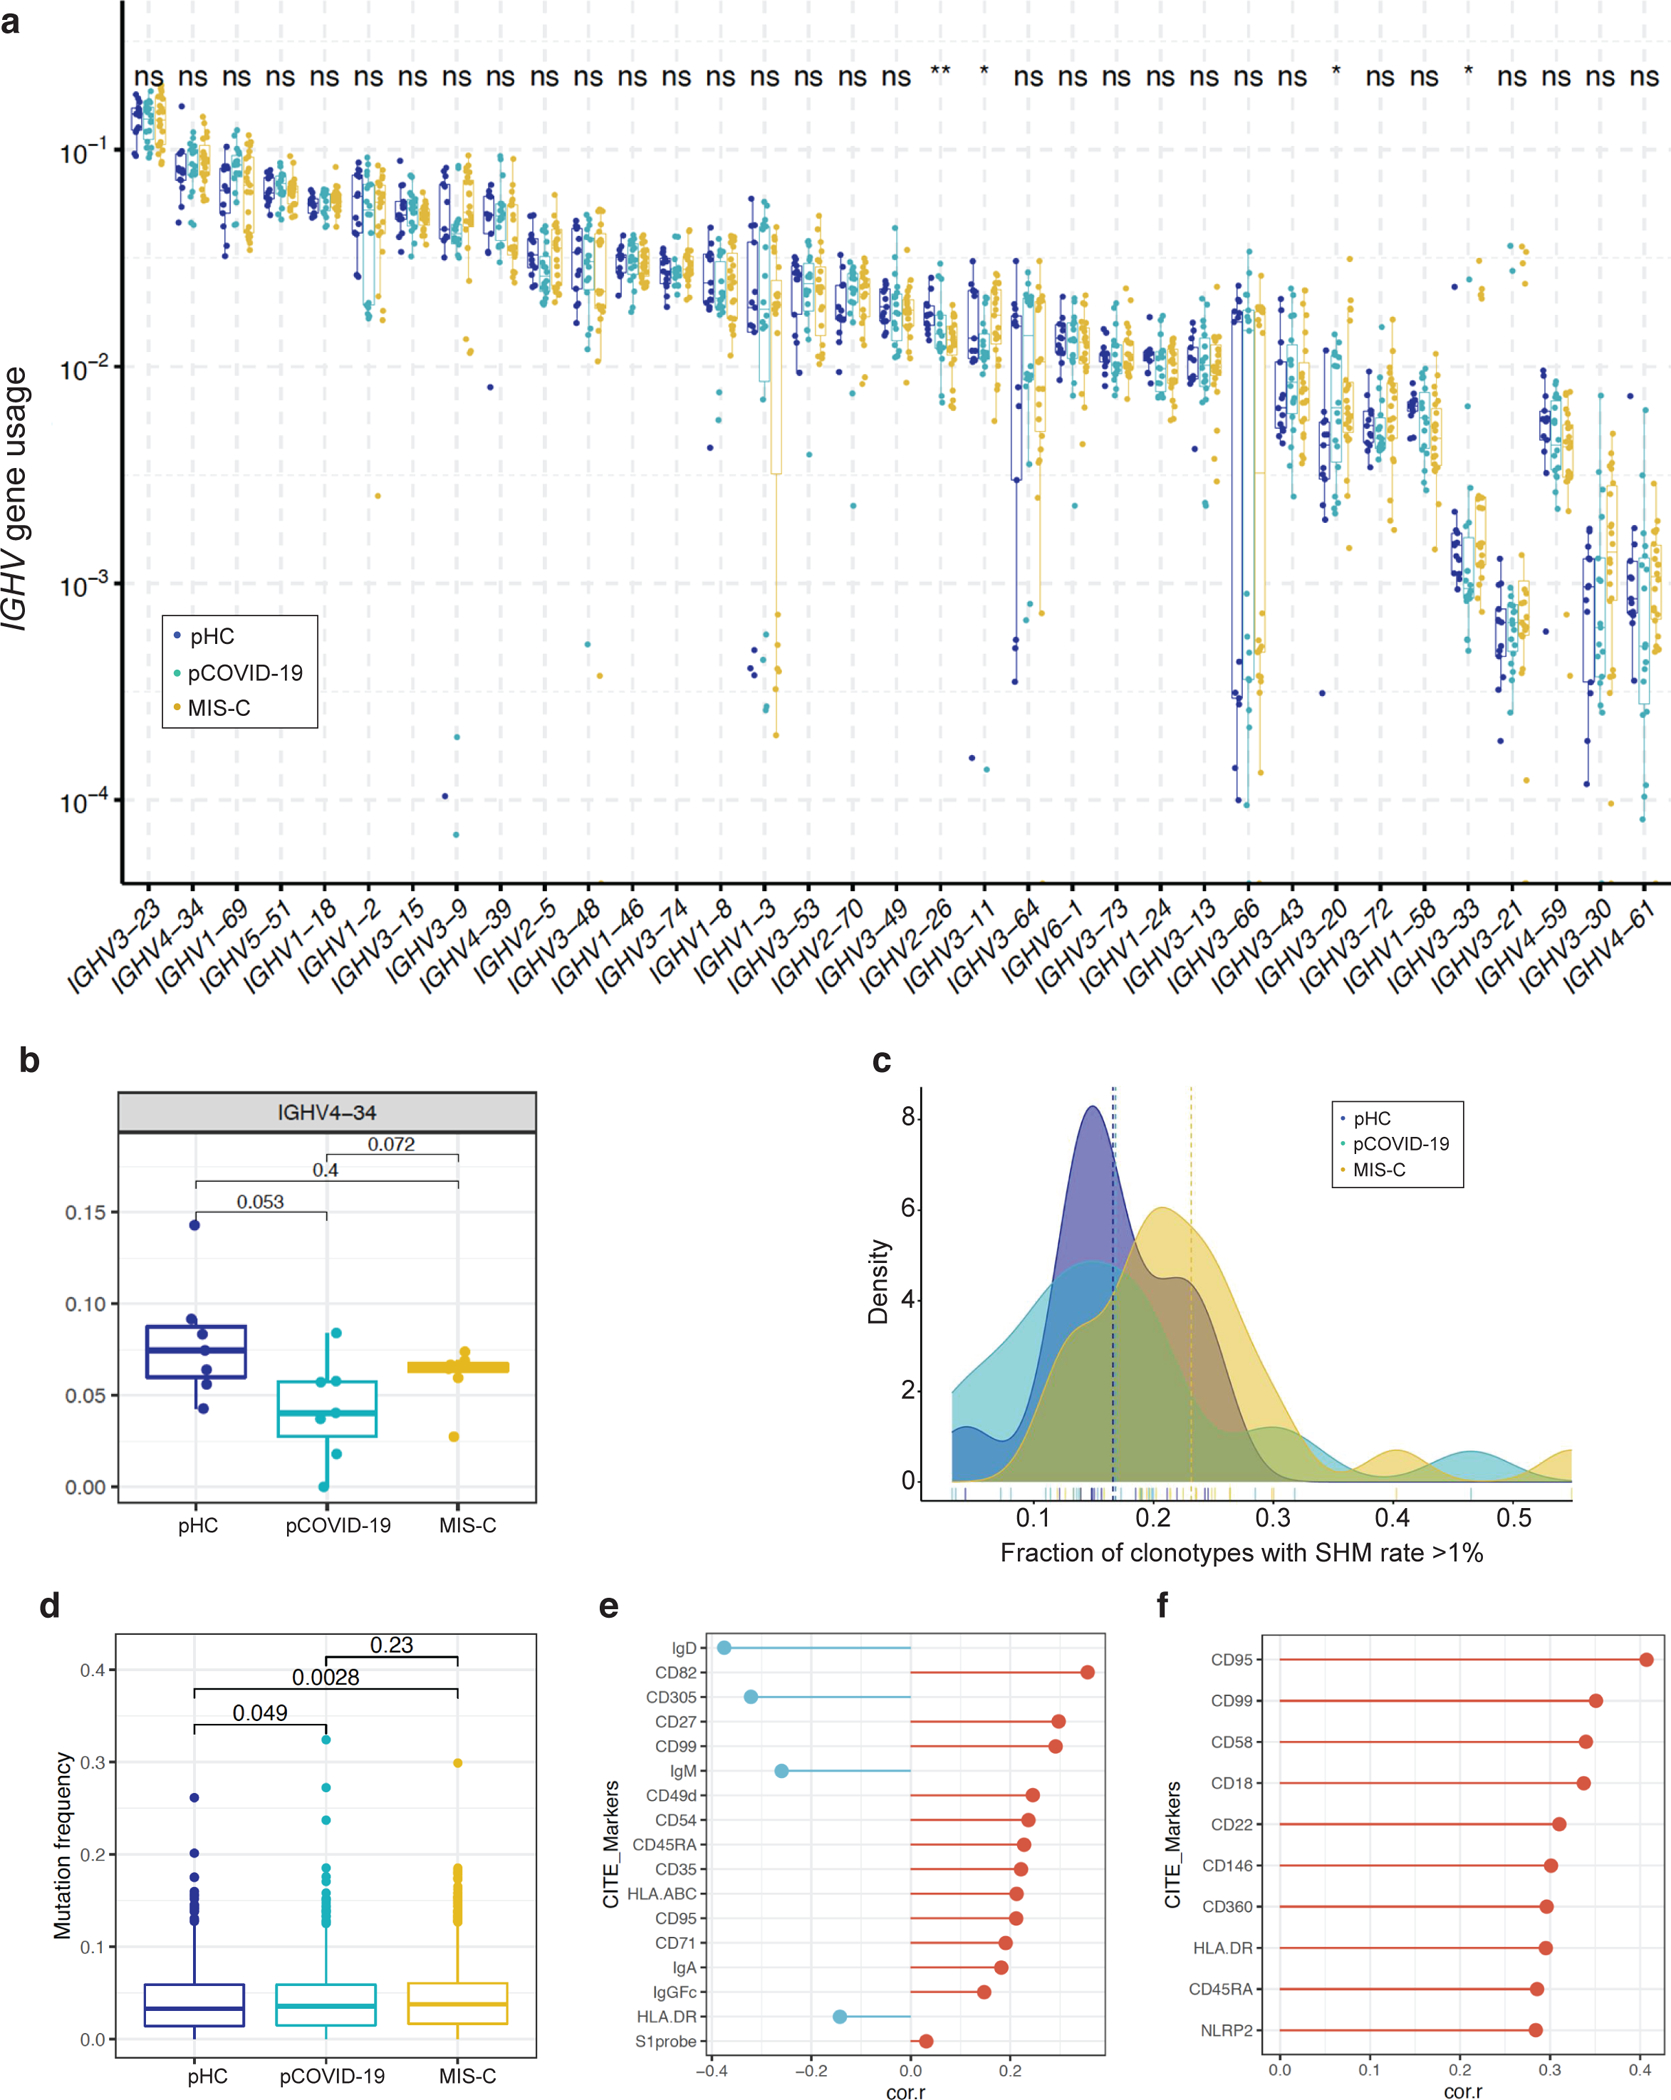
Extended Data Fig. 7: IGHV gene usage, mutation frequency and surface markers associated with mutation frequency.

a, Usage of IGHV genes in pediatric healthy controls (pHC, n=13 samples from 13 subjects), children with acute COVID-19 (pCOVID-19, n=18 samples from 15 patients) and MIS-C (n=23 samples from 19 patients). ns, not significant; *,p≤0.05; **p≤0.01; ***, p≤0.001; ****, p≤0.0001. Statistical analysis was done with Kruskal-Wallis test with unadjusted P values, with box plot showing the median, first and third quantiles (lower and upper hinges) and smallest (lower hinge - 1.5*interquartile range) and largest values (upper hinge + 1.5* interquartile range) (lower and upper whiskers).
b, Frequency of IGHV4–34 B cell clonotypes in pHC (n=7), pCOVID-19 (n=8) and MIS-C (n=8, 2 of which with 2 timepoints) within 40 days of admission. P values shown were obtained using two-sided Wilcoxon test between indicated two groups. Each dot indicates a sample. Box plot elements are the same as Figure 4e.
c, Fraction of IGHV clonotypes with a somatic hypermutation (SHM) rate >1% among unique clonotypes identified by high-throughput sequencing. Unadjusted P values (Wilcoxon rank sum test) were as follows: pHC versus pCOVID-19, P=0.514; pHC versus MIS-C, P=0.028; pCOVID-19 versus MIS-C, P=0.016.
d, Quantification of somatic hypermutation in memory B cells from pHC (n=7), pCOVID-19 (n=8) and MIS-C (n=7, 3 of which with 2 timepoints) patients. P values shown were obtained by applying two-sided Wilcoxon test between indicated two groups. Each dot indicates a cell. Box plot elements are the same as Figure 4e.
e, B cell surface markers correlating with mutation frequency in memory B cells from MIS-C patients. Pearson correlation values are shown (x-axis). Top 10 and a few selected significant markers are shown. S1 probe: SARS-CoV-2 spike protein probe.
f, Plasmablast cell surface markers correlating with mutation frequency from MIS-C patients. Pearson correlation values are shown (x-axis). Top 10 significant markers are shown.
