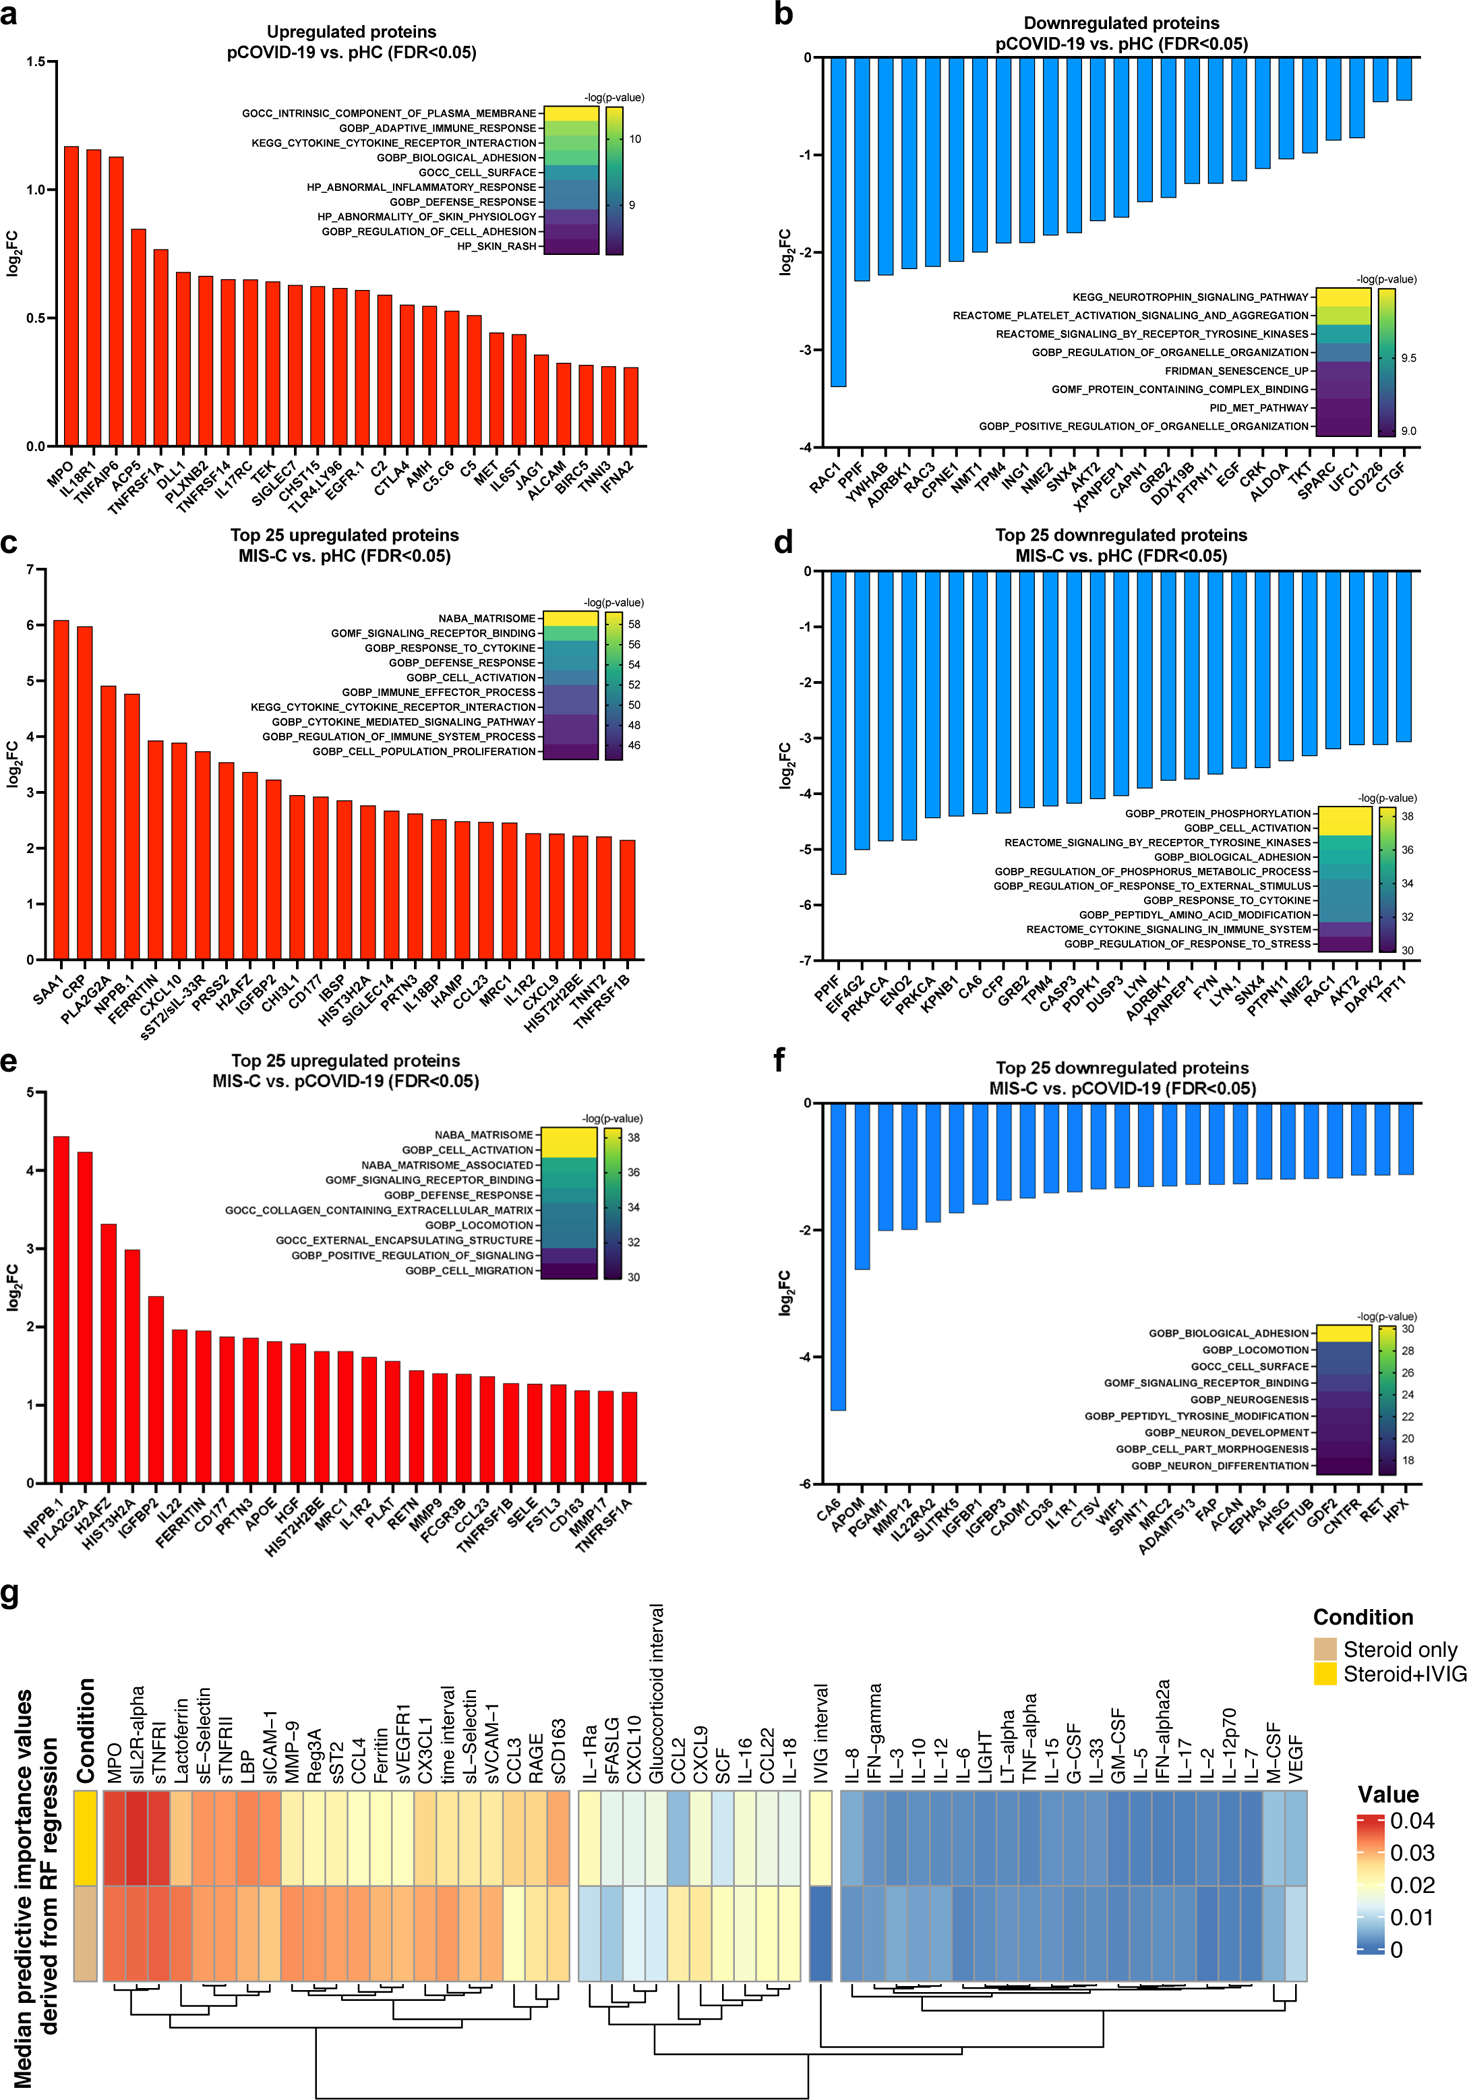
Figure 3 -. Proteomic analysis in MIS-C compared to pCOVID-19.

a, b, Upregulated (panel a) and downregulated (panel b) plasma proteins obtained from the comparison between pCOVID-19 (n=10) and pHC (n=4).
c, d, Top 25 up- and down-regulated plasma proteins obtained from the comparison between MIS-C (within the first 7 days of hospitalization, n=16) and pHC (n=4).
e, f, Top 25 up- and down-regulated plasma proteins obtained from the comparison between MIS-C (within the first 7 days of hospitalization, n=16) and pCOVID-19 (n=10).
g, Median predictive importance values derived from random forest regression of soluble biomarker values in a group of 101 samples obtained at various time points after hospitalization from 38 MIS-C patients who received both systemic glucocorticoids and IVIG, and in another group of 57 samples from 25 MIS-C patients who received systemic glucocorticoids only. In each random forest regression model (composed of 1000 decision trees with one model per target), predictive importance value for each predictor-target pair is computed using the algorithm described in ref.66.
In panels a-f, top up- and down-regulated proteins were identified by selecting all proteins with false discovery rate (FDR) <0.05 and p value <0.05 (two-tailed t-test), and then ordering them according to increased or decreased fold-changes expressed in a log2 scale. Heatmaps show the most significantly enriched pathways for the group comparison and the statistical significance is expressed as -log(p value).
