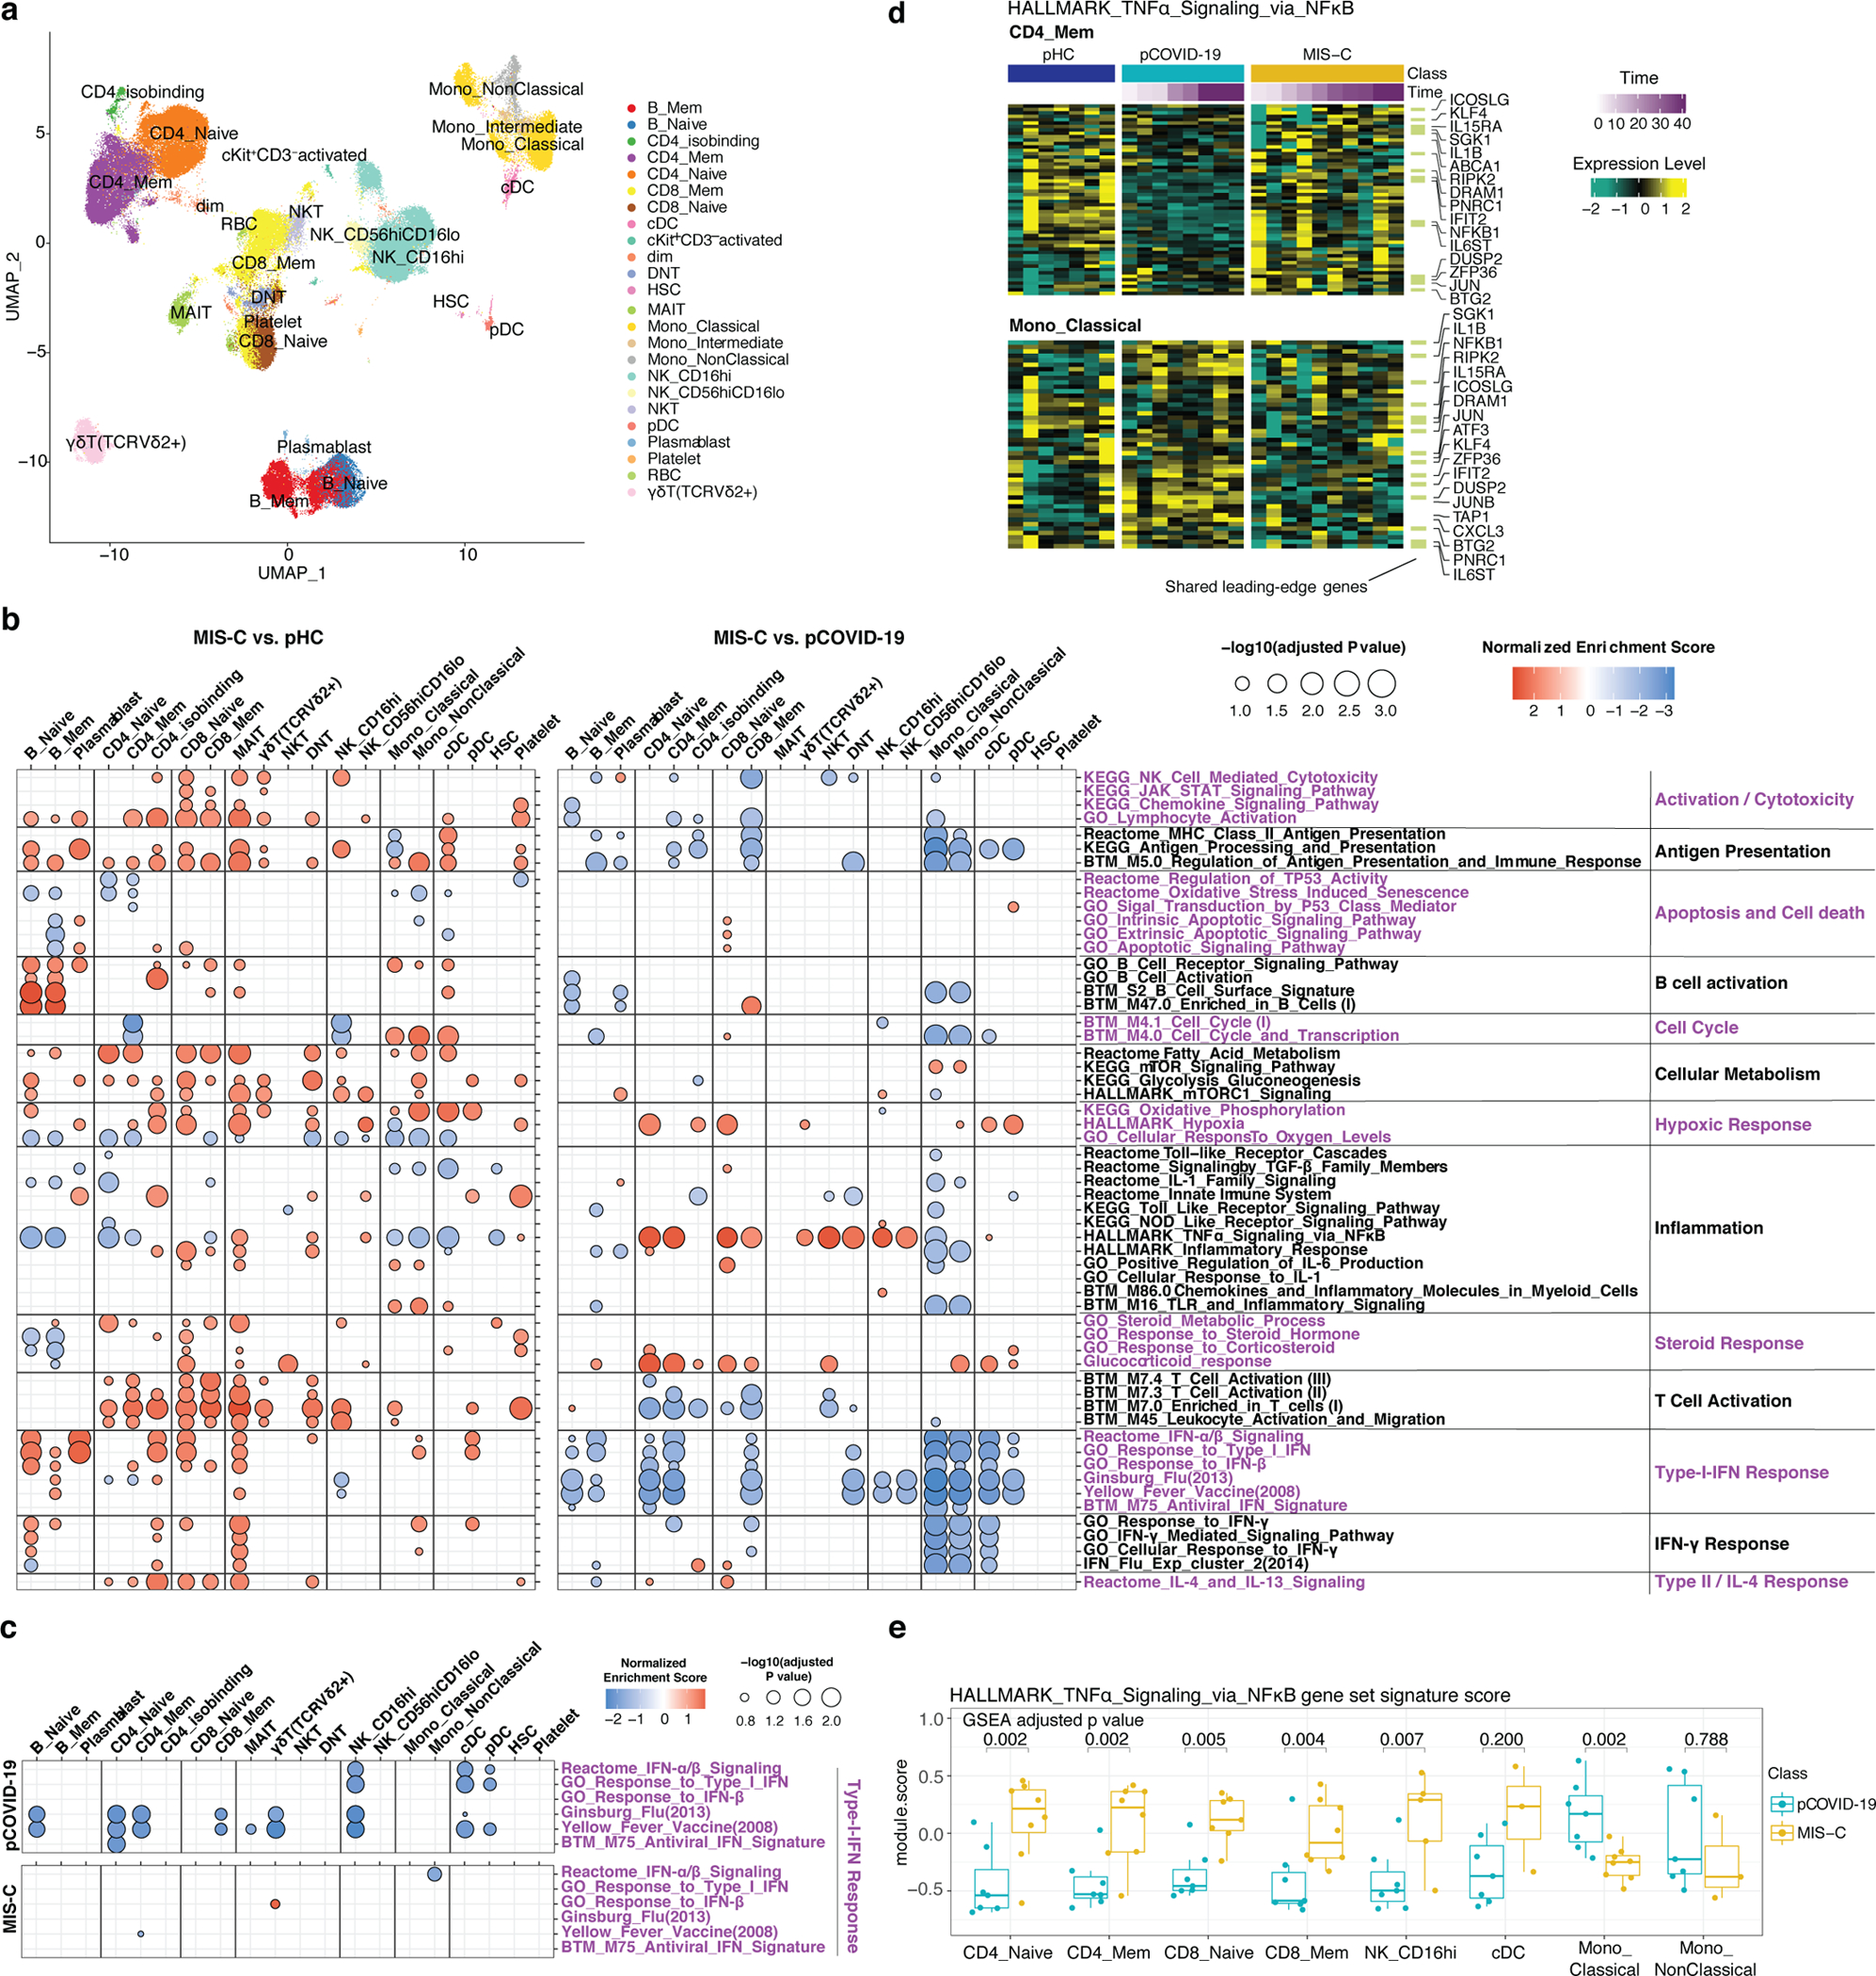
Figure 4 -. Multimodal single cell profiling of MIS-C and pCOVID-19.

a, UMAP visualization of single cell clusters based on protein expression profiles (see: Methods for cell type acronyms).
b, Gene set enrichment analysis (GSEA) of MIS-C versus pHC (left), and MIS-C versus pCOVID-19 (right), at timepoints within 40 days of admission. Selected gene sets are grouped into functional/pathway categories. Dot color denotes normalized gene set enrichment score and size indicates –log10(adjusted p value). P values were from GSEA test of the whole gene sets (see: Methods) and adjusted using the Benjamini-Hochberg method. The sample size for each group MIS-C n=8 (2 subjects with two timepoints), pCOVID-19 n=7, pHC n=7. Further details for statistical analysis are described in the Methods.
c, Gene set enrichment analysis (GSEA) result of pCOVID-19 (top) and MIS-C (bottom) based on the association with time (days since admission), only showing the type I IFN related response signatures. The sample size for each group MIS-C n=10 (3 subjects with two timepoints), pCOVID-19 n=8, pHC n=7.
d, Heatmap of HALLMARK_TNFa_Signaling_via_NFkB gene set in CD4+ Memory T cells and Classical Monocytes. Heatmap showing the scaled average mRNA expression (row z-score) of leading-edge (LE) genes from the GSEA analysis of MIS-C versus pCOVID-19. Shared LE genes and selected top LE from both cell types are labeled by gene symbol. The shared LE genes are annotated on the right column. Each column represents a sample. Subjects are grouped by pHC, pCOVID-19 and MIS-C classes, and columns are ordered by days since admission; also shown are the days since admission of each sample (top of the heatmaps).
e, Per-sample gene set signature scores of the HALLMARK_TNFα_Signaling_via_NFκB gene set in selected cell populations. Gene set scores were calculated using the gene set variation analysis of leading-edge genes from the MIS-C versus pCOVID-19 model (See Methods). P values shown are adjusted p values from GSEA result in (b). Box plot showing the median, first and third quantiles (lower and upper hinges) and smallest (lower hinge - 1.5*interquartile range) and largest values (upper hinge + 1.5* interquartile range) (lower and upper whiskers). Sample size was as follows: MIS-C, n=8 (2 subjects with two timepoints); pCOVID-19, n=7. See Methods for details of some low representative populations.
