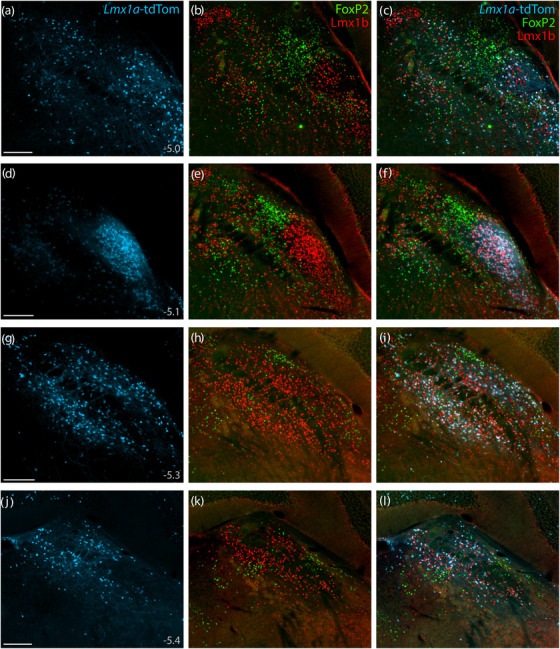
FIGURE 12.

Lmx1a Cre fate‐mapping. Cre fate‐mapping for Lmx1a (tdTomato, pseudocolored ice blue), followed by immunofluorescence labeling for Lmx1b (red) and FoxP2 (green), shown at four rostral‐to‐caudal levels through the PB region. Approximate level caudal to bregma is shown at bottom‐left in the first panel of each row (in mm). Scale bars (a, d, g, j) are 200 μm and apply to all other panels in the same row
