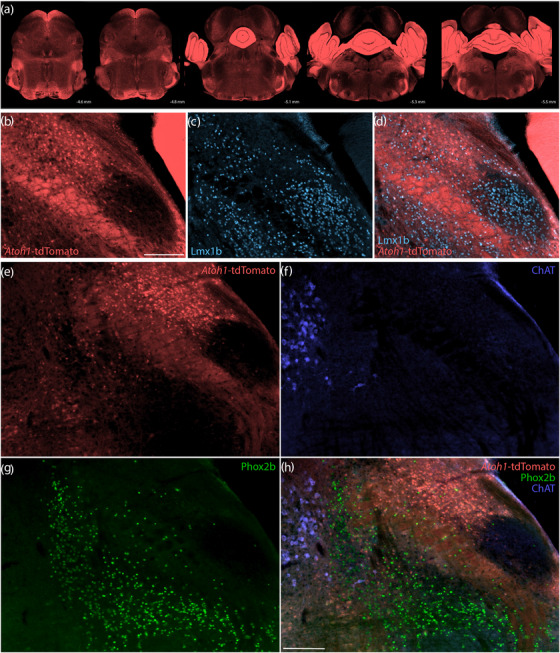
FIGURE 14.

Atoh1 Cre fate‐mapping with tdTomato. Cre fate‐mapping for Atoh1 identified neurons in the cerebellum, PB, and several other brainstem regions, plus extensive labeling in fibrous processes. (a) Fluorescent reporter expression for Atoh1‐Cre (tdTomato, pseudocolored coral‐red) across five rostral‐to‐caudal tissue sections spanning the PB region. At each level, the approximate distance caudal to bregma is shown at bottom‐right. (b–d) Cre fate‐mapping for Atoh1 followed by immunofluorescence labeling for Lmx1b (ice blue). (e–h) Immunofluorescence labeling for Phox2b (green) and ChAT (blue) at a mid‐level through the PB region (approximately bregma −5.1 mm). All scale bars are 200 μm. Scale bar in (b) also applies to panels (c, d). Scale bar in (h) also applies to panels (e–g)
