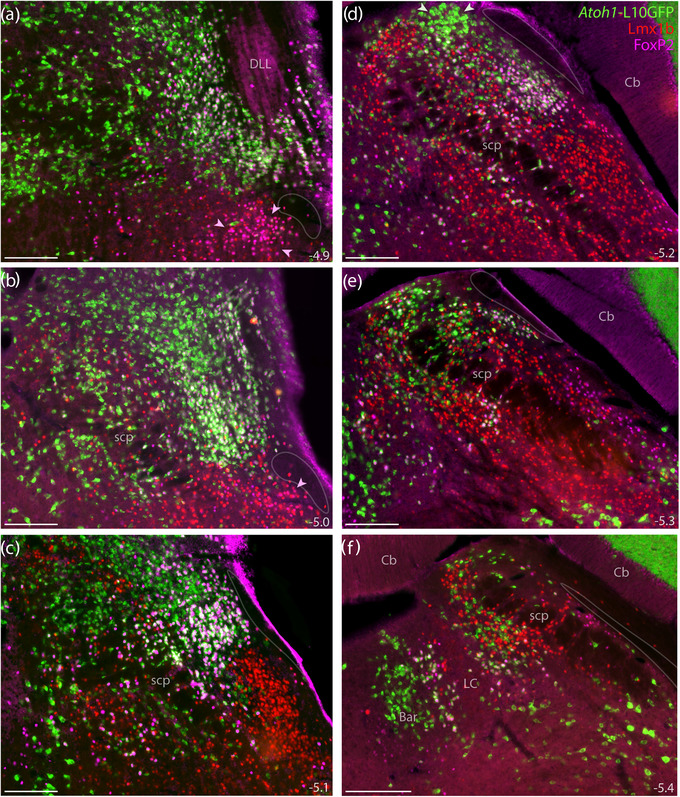
FIGURE 15.

Atoh1 Cre fate‐mapping with L10GFP. The L10GFP Cre‐reporter identified Atoh1‐derived cell bodies. Panels (a–f) show L10GFP expression across six rostral‐to‐caudal levels of the PB region in an Atoh1‐Cre;R26‐lsl‐L10GFP mouse after immunofluorescence labeling for Lmx1b (red) and FoxP2 (magenta). Nuclear FoxP2 immunofluorescence overlapping cytoplasmic L10GFP appears white. Arrowheads in panels (a, b) highlight the KF region. Arrowheads in (d) highlight a prominent, dorsal cluster of L10GFP‐expressing neurons. Translucent outlines in each panel show the location of a small white matter tract alongside the lateral PB and KF region, which is labeled “ventral spinocerebellar tract” in current brain atlases. Approximate distance caudal to bregma is provided at the bottom‐right of each panel (in mm). All scale bars are 200 μm
