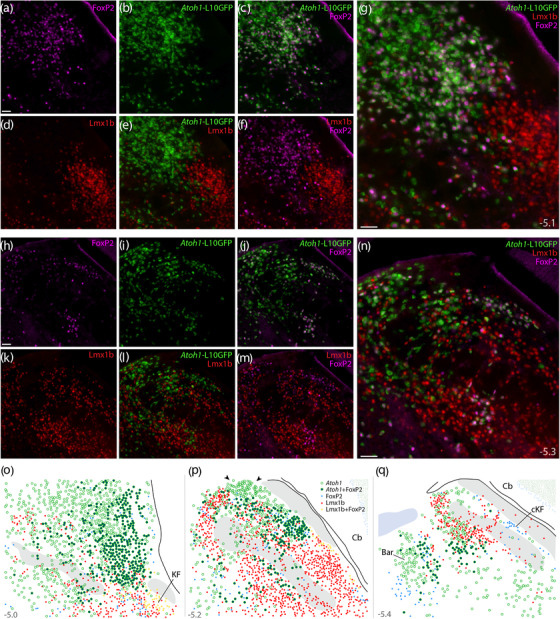
FIGURE 16.

Atoh1 Cre fate‐mapping with L10GFP: magnified color separations and plots. Panels (a–g) show immunofluorescence labeling for FoxP2 (magenta) and Lmx1b (red) after fate‐mapping for Atoh1‐Cre at a mid‐rostral level of the lateral PB. (h–n) Immunofluorescence labeling for FoxP2 and Lmx1b after L10GFP fate‐mapping for Atoh1‐Cre at a mid‐caudal level of the PB, centered over the “head” and “waist” of the scp. Approximate bregma levels are shown at bottom‐right in (g, n). All scale bars are 50 μm. Scale bar in (a) applies to (b–f) and scale bar in (h) applies to (i–m). (o, p) Rostral‐to‐caudal plots show the distribution of Atoh1‐derived neurons across the PB region, including large subsets with and without FoxP2. Arrowheads in (p) highlight a dorsal cluster of L10GFP‐expressing neurons that lack FoxP2. Throughout the PB, Lmx1b and L10GFP were mutually exclusive (no L10GFP‐expressing PB neurons contained Lmx1b). Approximate bregma levels are shown at bottom‐right in (g, n). Abbreviation: cKF, “caudal KF” population
