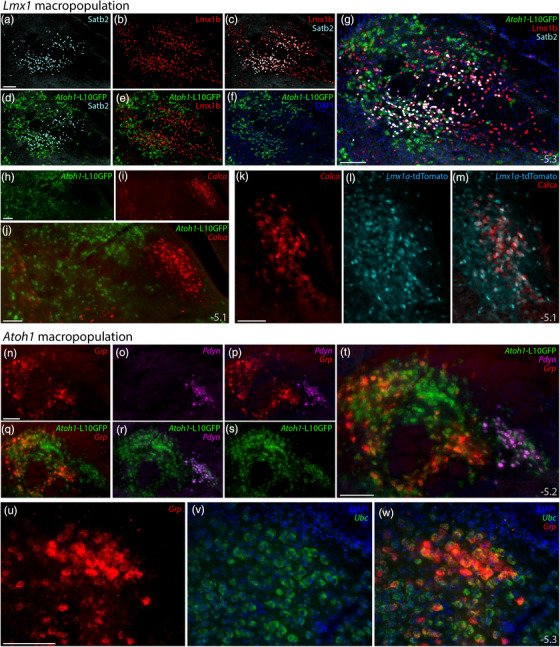
FIGURE 18.

Subpopulations of Lmx1‐ and Atoh1‐derived PB neurons. Subsidiary genes define separate subpopulations within the Atoh1‐ and Lmx1‐derived PB macropopulations. (a–g) Immunofluorescence labeling for Satb2 (light blue) and Lmx1b (red) with L10GFP Cre‐reporter for Atoh1 (green) at a mid‐caudal level of the PB. (h–j) FISH labeling for Calca (red) with L10GFP Cre‐reporter for Atoh1 (green) at a mid‐level of the PB. (k–m) FISH labeling for Calca with tdTomato (pseudocolored ice blue) Cre‐reporter for Lmx1a in PBeL. (n–t) FISH labeling for Grp mRNA (red) and Pdyn mRNA (magenta) with L10GFP Cre‐reporter for Atoh1 (green) at a mid‐caudal level of the PB. (u–w) FISH labeling for Grp mRNA (red) in a dorsal cluster of larger neurons that resemble the “internal lateral” subnucleus of the rat PB (Fulwiler & Saper, 1984), with Ubc mRNA (green) shown for neuroanatomical background. Approximate bregma levels shown at bottom‐right in (g, j, m, t, w). All scale bars are 100 μm and apply to similar panels
