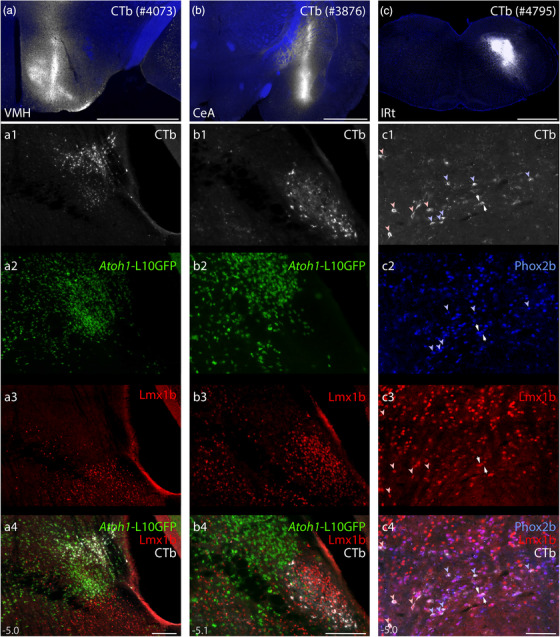
FIGURE 21.

Distal targets of axonal projections from separate PB macropopulations. Neurons in the PB region contained retrograde CTb labeling after tracer injections into the ventromedial hypothalamic nucleus (VMH), central nucleus of the amygdala (CeA), and intermediate reticular formation (IRt). (a–c) CTb injection sites (white). (a1–a4) Immunofluorescence labeling for CTb (white) after tracer injection into the VMH along with L10GFP Cre‐reporter expression in Atoh1‐derived neurons and Lmx1b immunofluorescence (red) at a level approximately 5.0 mm caudal to bregma. (b1–b4) Immunofluorescence labeling for CTb after tracer injection into the CeA, along with L10GFP Cre‐reporter for Atoh1 and Lmx1b immunofluorescence (approximately 5.1 mm caudal to bregma). (c1–c4) Immunofluorescence labeling for CTb, Phox2b (blue), and Lmx1b along the ventral border of the PB. Light blue arrowheads indicate neurons that contain both CTb and Phox2b. Light red arrowheads indicate neurons that contain both CTb and Lmx1b. White arrows highlight neurons that contain CTb and both transcription factors. Approximate bregma levels are shown at bottom‐left in (a4, b4, c4). Scale bars in (a–c) are 1 mm. Scale bars in (a4–c4) are 200 μm and apply to panels above
