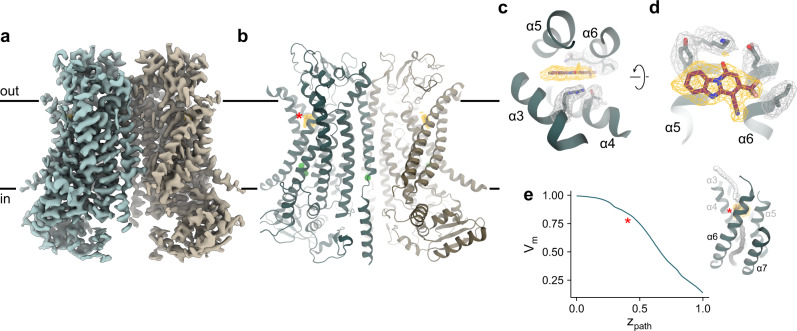
Fig. 3. Structure of TMEM16A in complex with 1PBC and Ca2+.
Cryo-EM map (a) and ribbon representation (b) of mouse TMEM16A in a 1PBC- and Ca2+-bound form viewed from within the membrane. Black lines, membrane boundaries; green spheres, bound Ca2+; yellow mesh, density of the bound 1PBC molecule. Close-up view of the binding site from the extracellular side (c) and from within the membrane (d). Selected densities and sidechains are shown. e Membrane potential profile of the pore in the 1PBC/Ca2+-bound structure. Inset, coordinates (spheres) where the transmembrane potential was calculated. The spheres are colored according to the calculated values. The membrane potential profile was calculated using the PBEQ module in CHARMM (see “Methods”). b, e Asterisk indicates the location of the 1PBC binding site.

