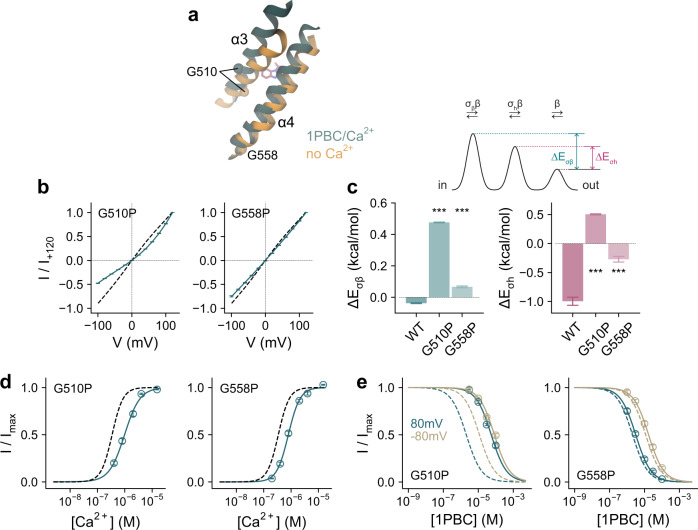
Fig. 8. Functional characterization of conformational changes.
a Section of the pore in the superposed 1PBC/Ca2+-bound and the rebuilt Ca2+-free apo structures viewed from within the membrane. Spheres show Cα of Gly 510 and Gly 558 on α3 and α4 respectively. b Instantaneous current-voltage relations of the indicated mutants at a saturating Ca2+ concentration (15 and 50 µM respectively). Data are averages of 5 and 6 biological replicates for G510P and G558P respectively, errors are SEM. Solid lines are fits of the averaged data to a model of ion permeation as described previously (Eq. 2)23. Dashed line is the relation of WT. c Energy barrier relative to the outermost barrier in the ion conduction path at the inner pore and the narrow neck region for the indicated mutants (Eq. 3 and see “Methods”). Bars indicate the best-fit values obtained via the fits shown in (b), errors are 95% CI. Inset, minimal ion permeation model illustrating the quantities plotted in (c). Asterisks indicate significant difference in a non-adjusted two-sided t-test (left, G510P, ***p = 0 and G558P, ***p = 3e−12; right, G510P, ***p = 2e−13 and G558P, ***p = 1e−14, each compared to WT). d Ca2+ concentration-response relation of the indicated mutants at 80 mV. Data are averages of 7 biological replicates for both G510P and G558P, errors are SEM. Solid lines are fits to the Hill equation. Dashed line shows the relation of WT. e Concentration-response relations of 1PBC of the indicated mutants at a saturating Ca2+ concentration (15 µM) at −80 and 80 mV. Data are averages of 9 and 8 biological replicates for G510P and G558P respectively, errors are SEM. Solid lines are fits to the Hill equation. Dashed lines are the relations of WT.

