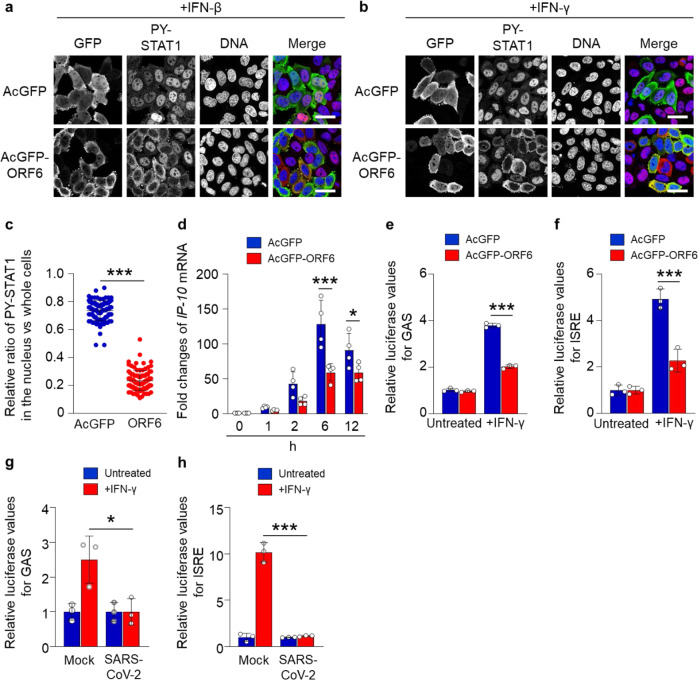
Fig. 1. Inhibition of nuclear localization of PY-STAT1 by ORF6.
a, b Immunofluorescence of phosphorylated STAT1 (PY-STAT1) in HeLa cells transfected with AcGFP or AcGFP-ORF6 following interferon-β (IFN-β) a or IFN-γ b stimulation. GFP (green) and PY-STAT1 (red) were identified using specific antibodies. DAPI staining (blue) was used for DNA staining. Scale bars: 30 μm. c The graph represents the relative fluorescence values of PY-STAT1 in the nucleus compared to those of the whole cells (shown in b). Signal intensities of total 100 different nuclei from two independent experiments. ***P < 0.001, two-tailed Student’s t-test. error bars represent SD. d qRT-PCR analysis of IP-10 mRNA in AcGFP or AcGFP-ORF6-transfected HeLa cells at the described time points (n = 4 each). *P < 0.05, ***P < 0.001, two-way ANOVA. error bars represent SD. e, f Relative luciferase values of GAS-Luc e or ISRE-Luc f in AcGFP- or AcGFP-ORF6-transfected Huh7 cells following IFN-γ stimulation (n = 3 each). ***P < 0.001, one-way ANOVA. error bars represent SD. g, h Relative luciferase values of GAS-Luc g or ISRE-Luc h in VeroE6/TMPRSS2 cells infected with SARS-CoV-2 (NIID strain) following IFN-γ stimulation (n = 3 each). *P < 0.05, ***P < 0.001, one-way ANOVA. error bars represent SD.

