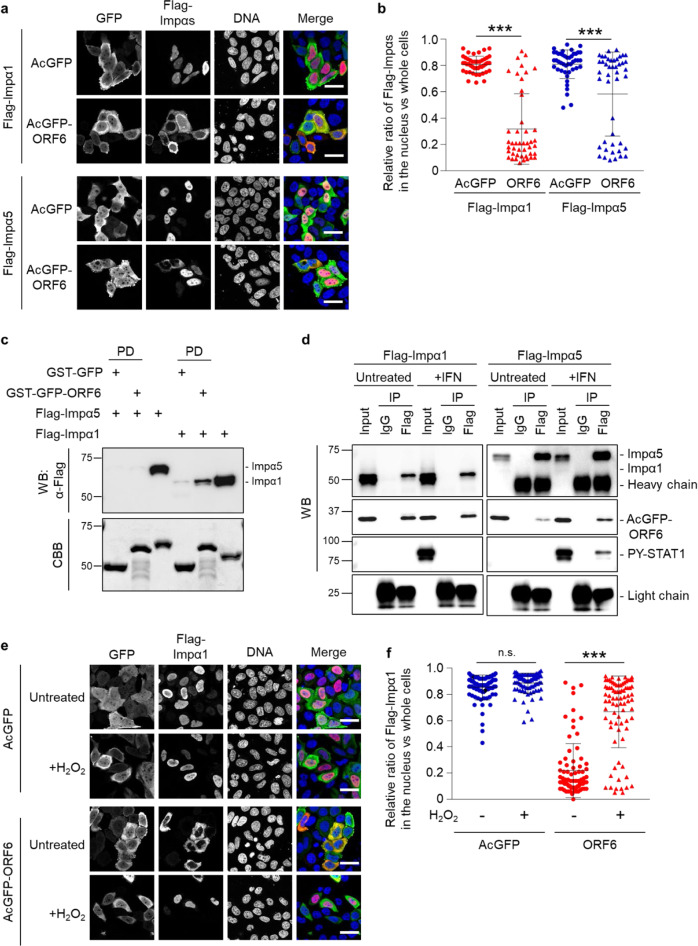
Fig. 5. ORF6 affects the subcellular localization of importin α proteins.
a Immunofluorescence of Flag-importin α1 (Flag-Impα1) and Flag-importin α5 (Flag-Impα5) in HeLa cells transfected with AcGFP or AcGFP-ORF6. Anti-GFP and anti-Flag antibodies were used for detection of AcGFP (green) and Flag-importin αs (red), respectively. DAPI was used to stain the DNA (blue). Scale bars: 30 μm. b The graph represents the relative fluorescence values of Flag-importin αs in the nucleus compared to those of the whole cells in a. Signal intensities of total 50 nuclei from two independent experiments were measured. ***P < 0.001, two-tailed Student’s t-test. error bars represent SD. c The Flag-Impα1 or Flag-Impα5 recombinant proteins were incubated with GST-GFP and GST-GFP-ORF6 immobilized on GST-beads for 1 h, and then a pulled-down protein was collected (PD). The importin α proteins were detected using an anti-Flag antibody (WB). The bottom panel represents the proteins bound to the beads and stained with CBB. Either the Flag-Impα1 protein or the Flag-Impα5 protein was loaded as an input protein (1/20,000 dilution of the reaction). Values are kDa. d Immunoprecipitation (IP) of Flag-Impα1 or Flag-Impα5 from AcGFP-ORF6-transfected HEK293 cells following IFN-γ stimulation. HEK293 cells transfected with AcGFP-ORF6 and each Flag-importin α were treated with IFN-γ (+IFN) for 1 h. The cell lysates were incubated with anti-Flag antibody for IP. Each importin α was detected by the specific antibodies (WB). Anti-HA and anti-PY-STAT1 antibodies were used for detection of AcGFP-ORF6 and endogenous PY-STAT1, respectively. Normal mouse IgG was used as a negative control for IP. Light chain indicates the antibodies precipitated. Input was 1/400 dilution of cell lysates used for the reaction. Heavy chain appeared in the Flag-Impα5 IP sample. e Immunofluorescence of Flag-Impα1 in HeLa cells transfected with AcGFP or AcGFP-ORF6 following hydrogen peroxide (200 μM H2O2) treatment. Anti-GFP and anti-Flag antibodies were used for the detection of AcGFP (green) and Flag-Impα1 (red), respectively. DAPI was used to stain the DNA (blue). Scale bars: 30 μm. f The graph represents the relative fluorescence values of Flag-Impα1 in the nucleus compared to those of the whole cells in e. Signal intensities of total 80 nuclei from two independent experiments were measured. ***P < 0.001, n.s.: not significant, two-tailed Student’s t-test. error bars represent SD.

